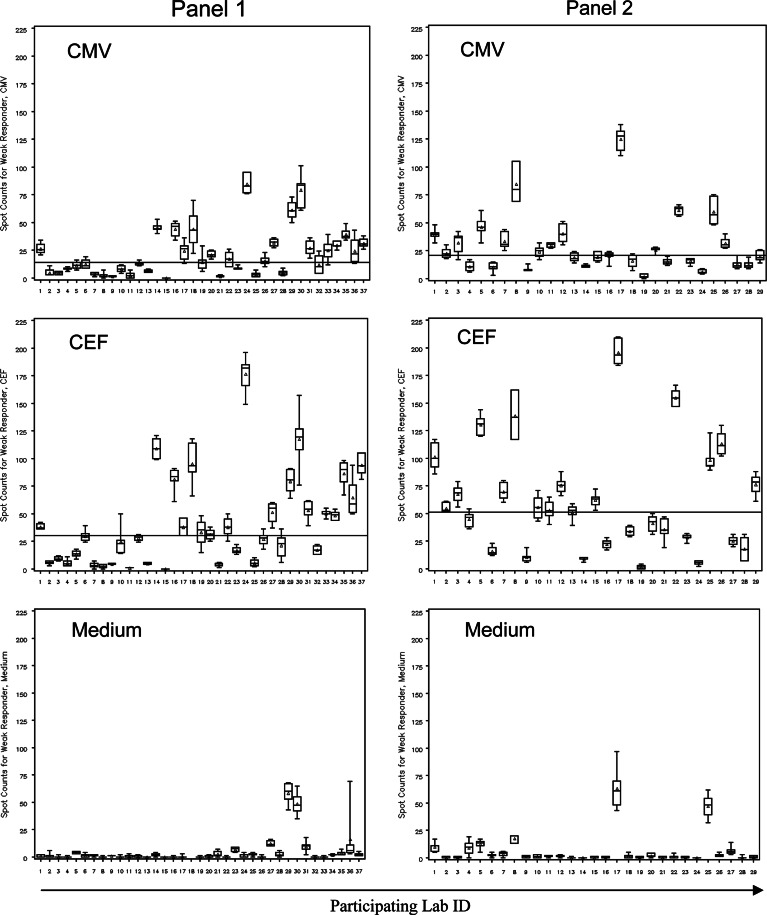
Fig. 2.
Laboratory spot counts and variability for low responder across panel participants. Panel 1 left column, panel 2 right column. The reagent tested is indicated. Lab-specific spot counts per 200,000 cells are depicted as box plots with the box presenting the interquartile range, the triangle the mean and the horizontal line the median. Maximum and minimum spot counts are illustrated through the upper and lower mark. The horizontal line across a graph demonstrates the overall panel median. The central laboratory performed the assay under two different conditions in panel 1. Results from both experiments are presented; therefore 37 laboratories for panel 1. Laboratory ID numbers do not correlate in both panels. In panel 1, laboratory #18 reported spot counts for the medium control as high as 270 per well (mean 81, median 34.5). For proper illustration of all other panel data, these data were omitted from the graph. Intra-laboratory variability and variability among participants as well as reactivity against medium are representative for all responder PBMCs tested

