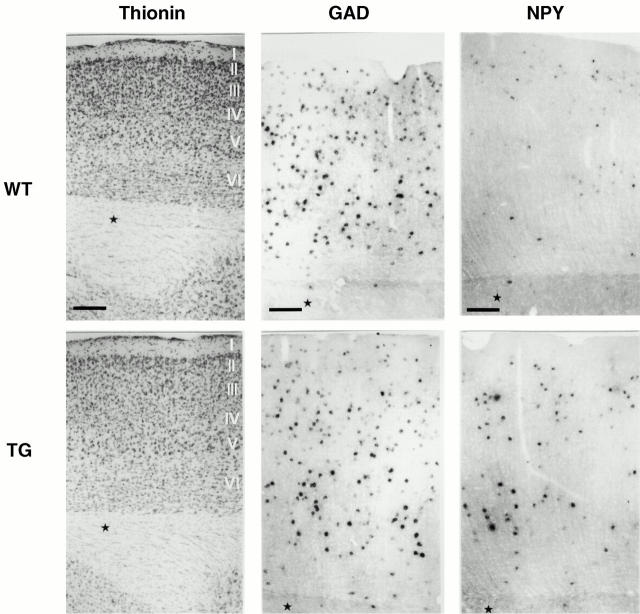
Figure 4.
In situ mRNA determination of cDNAs coding for NPY and GAD. Thionin staining (Thionin) of a cross-section through the cortex with layers I–VI is shown, as indicated for wt (top) or synRas-TG (bottom) mice. Bar, 150 μm. The density and intensity of NPY mRNA–expressing neurons is upregulated throughout the cortex of synRas-TG mice (NPY, top and bottom). Bar, 100 μm. However, GAD cDNA expression is not affected (GAD, top and bottom). Bar, 100 μm. Note the increased cross-sectional length of the total cortical layer from the pia mater to the borderline layer VI between wt (∼720 μm) and synRas-TG mice (compare stars).

