
Figure 1.
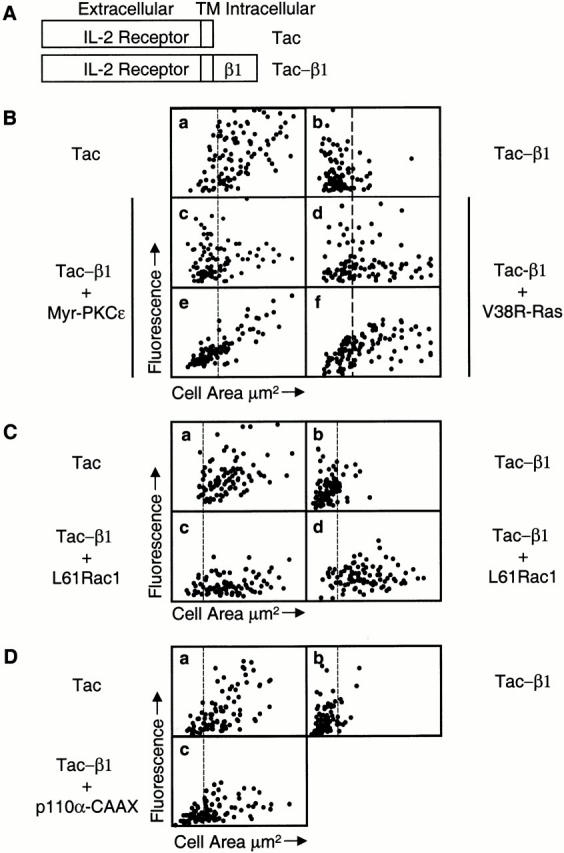
Coexpression of either myr-PKCε, V38R-Ras, L61Rac1, or p110α-CAAX with tac-β1 can restore cell spreading on collagen I. (A) Diagram of the control tac receptor containing the extracellular and transmembrane domains of the small (tac) subunit of the human interleukin-2 receptor and the tac-β1 chimera containing the same domains of the interleukin-2 receptor fused to the human integrin β1A cytoplasmic domain. (B) Fibroblasts were transfected with tac (a) or tac-β1 (b), or cotransfected with tac-β1 and myr-PKCε-Flag (c and e) or tac-β1 and myc-V38R-Ras (d and f). Cell area for 100 randomly sampled positively transfected cells is plotted as a function of either tac epitope expression (a–d), myr-PKCε-Flag expression (e) for the same cells shown in c, or myc-V38R-Ras expression (f) for the same cells shown in d. The x axis is a linear scale of cell area from 0 to 1,600 μm2, the y axis is a linear scale of either FITC fluorescence (tac epitope expression) units defined by Image Pro-Plus from 0 to 2.4 × 10⁴ (a–d) or rhodamine fluorescence (Flag or myc epitope expression) from 0 to 1.2 × 10⁵ (e and f). (C) Fibroblasts were transfected with tac (a) or tac-β1 (b), or cotransfected with tac-β1 and myc-L61Rac1 (c and d). Cell area for 90 randomly sampled cells expressing tac, tac-β1, or coexpressing tac-β1 and myc-L61Rac1 is plotted as a function of tac epitope expression (a–c) or myc epitope expression (d) for the cells shown in c. The x axis is a linear scale of cell area from 0 to 2,400 μm2, the y axis is a linear scale of FITC fluorescence (tac epitope expression) from 0 to 2.4 × 10⁴ (a–c) or rhodamine fluorescence (myc epitope expression) from 0 to 1.2 × 10⁵ (d). (D) Fibroblasts transfected with the control tac receptor (a) or tac-β1 (b) or tac-β1 and p110α-CAAX (c) were analyzed for cell-surface expression of the tac epitope and cell area, as described in Materials and Methods. Cell area for 98 randomly sampled positively transfected cells is plotted as a function of tac epitope expression. The x axis is a linear scale of cell area from 0 to 2,400 μm2 and the y axis is a linear scale of FITC fluorescence (tac epitope expression) from 0 to 3.2 × 10⁴ (a) or 0 to 1.6 × 10⁴ (b and c). (B–D) The vertical line positioned at a cell area of 560 μm2 indicates the separation of spread (right) and not spread (left) cells. It is important to note that our spreading assays primarily analyze cells expressing moderate to low levels of tac-β1, since cell attachment to collagen I is inhibited by the expression of high levels of tac-β1 (data not shown). This observation is consistent with our recent studies showing that high levels of tac-β1 inhibit cell attachment to fibronectin (Mastrangelo et al. 1999a). The range of FITC fluorescence represents the range of tac-β1 expression detected in the adherent transfected cells. These experiments were performed three times and similar results were obtained.