Figure 2.

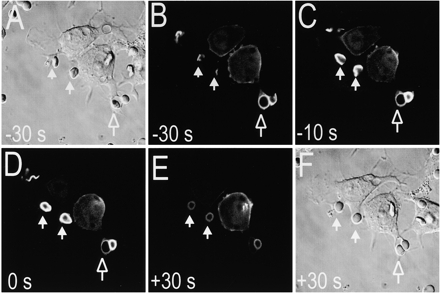
Time course of accumulation of 3′PI in phagosomes. RAW 264.7 cells transfected with Akt-PH–GFP were exposed to IgG-opsonized SRBCs to initiate phagocytosis. Confocal fluorescence (B–E) and DIC images (A and F) were acquired at the indicated times. The time of closure of the two phagosomes noted by solid white arrows was arbitrarily chosen as time 0. A phagosome that had sealed before the acquisition of the first image is shown by an open arrow. Images are representative of six similar time course determinations.
