
Figure 4.
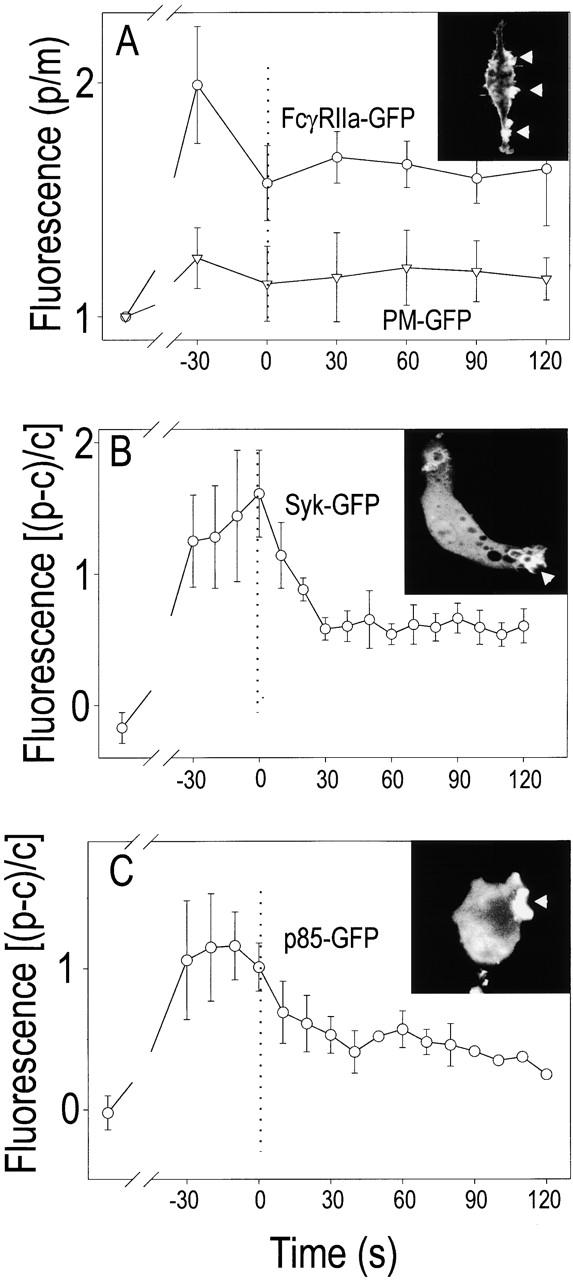
Quantitation of the time course of accumulation of Fc receptors, Syk, and PI3K on phagosomes. RAW 264.7 cells transfected with either FcγRIIa-GFP (A, ○), PM–GFP (A, ▿), Syk-GFP (B), or p85-GFP (C) were exposed to IgG-opsonized SRBCs to initiate phagocytosis, and confocal images were acquired. Representative images are shown in the insets. The time of closure of the phagosomes was arbitrarily defined as time 0. Quantitation in B and C was as in the legend to Fig. 2. In A, the ordinate refers to the fluorescence intensity of the phagosomal membrane (p) relative to the extraphagosomal (usually contralateral) plasmalemma (m). Data are mean ± standard error of at least three experiments.