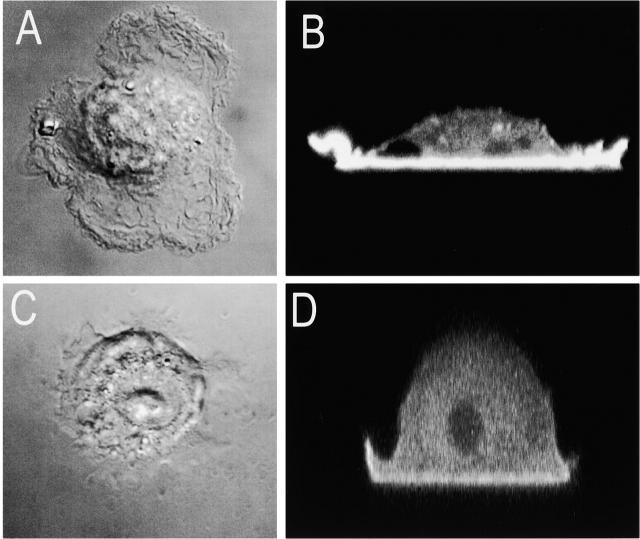
Figure 5.
Distribution of Akt-PH–GFP in cells adhering to IgG-coated versus uncoated glass. RAW 264.7 cells transfected with Akt-PH–GFP were detached by resuspension in HPMI with 2 mM EDTA and then allowed to sediment on either IgG-coated (A and B) or uncoated glass (C and D) for ∼10–20 min. DIC (A and C) and confocal fluorescence images were acquired, and vertical (x versus z) sections of Akt-PH–GFP are illustrated (B and D). Images are representative of five similar determinations.

