Figure 6.
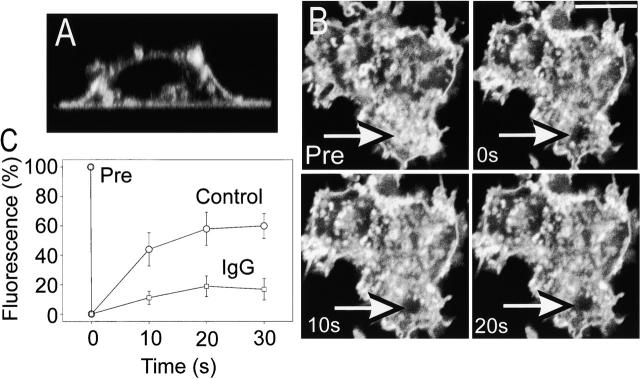
Measurement of PM–GFP FRAP. RAW 264.7 cells transfected with PM–GFP were detached by gentle scraping and then allowed to sediment on either IgG-coated or uncoated glass coverslips. (A) Confocal fluorescence images of a cell plated on IgG were acquired, and reconstruction of a vertical (x versus z) section is illustrated. (B) Confocal (x versus y) images of the adherent membrane were acquired before (Pre), immediately after (0 s), and at the indicated intervals following photobleaching of a spot near the edge of the membrane. In C, the rate of recovery after bleaching was quantified and compared for cells plated on glass (○) or IgG (□). Data are mean ± standard error of six individual experiments.

