
Figure 2.
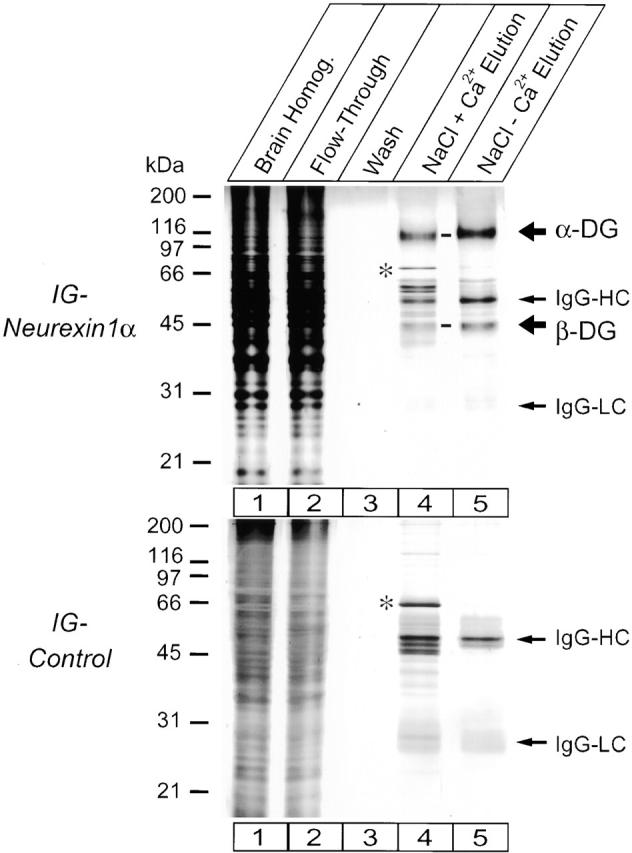
Affinity purification of dystroglycan on Ig–neurexin analyzed by SDS-PAGE and silver staining. Solubilized proteins from total rat brain homogenate (lane 1) were applied in 0.1 M NaCl and 2.0 mM Ca2+ buffer to a column containing immobilized Ig–N1α-1 or Ig–control proteins, and the flow-through was collected (lane 2). The column was washed extensively with loading buffer (lane 3) and 0.2 M NaCl, 2.0 mM Ca2+ buffer (not shown), and eluted with 1.0 M NaCl, 2.0 mM Ca2+ buffer (lane 4) followed by 1.0 M NaCl, 5 mM EGTA buffer (lane 5). Fractions were analyzed by SDS-PAGE and silver staining. The 120- and 43-kD proteins only present in the Ig–N1α-1 eluent correspond to α- and β-dystroglycan (α-DG and β-DG). IgG-HC and IgG-LC, respectively, and minor contaminants (for example, the 75-kD band labeled with an asterisk) were equally retained on the neurexin and the control column, presumably by binding to protein A–Sepharose.