
Figure 1.
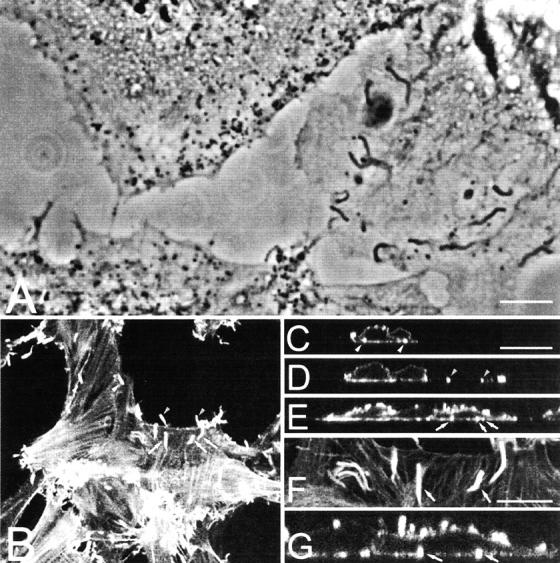
Distribution of actin tails in infected cells. (A) Phase–contrast microscopy. BS-C-1 cells were infected with VV at 1 PFU/cell and at 12 hpi fixed with methanol and photographed under phase–contrast. The actin tails with dense particles at their tips are visible. (B) Confocal microscopy. RK13 cells were infected with VV as in A and fixed and permeabilized at 9 hpi. Cells were stained with rhodamine-conjugated phalloidin, and a single optical section at the base of the cell is shown. Arrows denote pairs of actin tails that are also illustrated in the vertical optical section shown in C–E. F is a magnification of B, showing two actin tails that are shown in the vertical section in G. Bars, 5 μm.