
Figure 2.
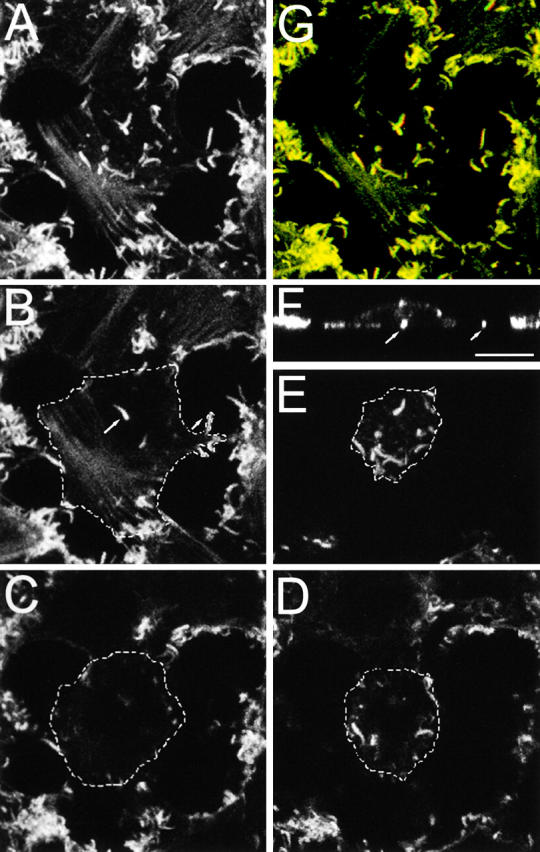
VV-induced actin tails are formed from the cell surface. RK13 cells were infected with VV, stained with phalloidin, and analyzed by confocal microscopy as described in the legend to Fig. 1 B. A shows a z-series reconstruction (17 sections), and G shows this projection as a stereo anaglif. B–E show projections of individual optical sections moving from the basolateral (B) to the apical surface (E). The outline of the cell is drawn with a dotted line. F shows a vertical section of the cell illustrating the positions of the actin tails shown in B. Arrows in B and F mark the same actin tails. Bar, 5 μm.