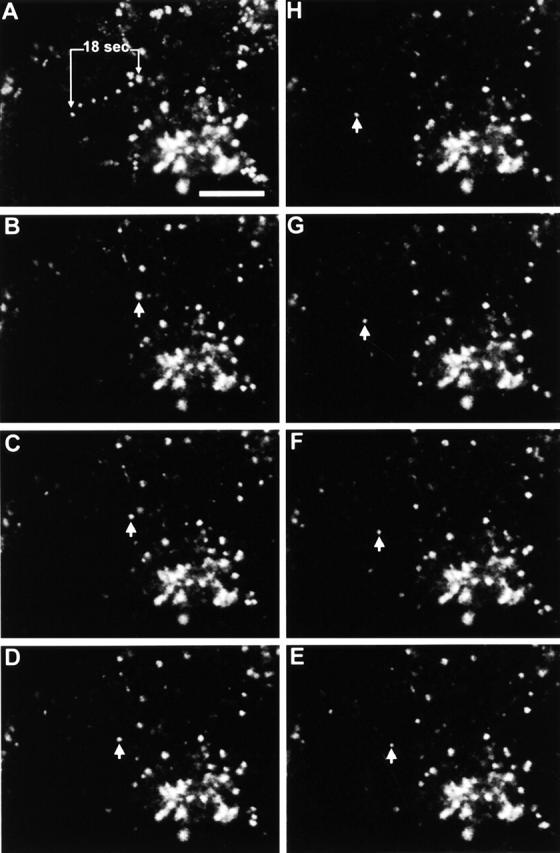
Figure 9.

Real time movement of CEV particles in infected cells. Images from a single optical plane of a cell 8 hpi with vB5R-EGFP were taken at 3-s intervals. (A) Projection of movement of vB5R-EGFP over 18 s. B–H show the position of the single particle (arrowhead) at 3-s intervals. Calculated speed of movement 40 μm/min. Bar, 10 μm.
