Figure 3.
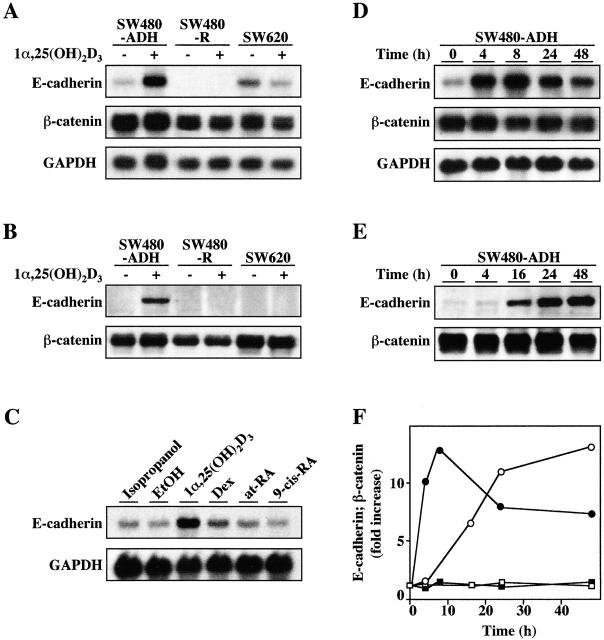
Induction of E-cadherin expression by 1α,25(OH)2D3. (A) Northern blot analysis of E-cadherin and β-catenin mRNA expression in SW480-ADH, SW480-R, and SW620 cells untreated or treated with 10−7 M 1α,25(OH)2D3 for 48 h. 10 μg of poly(A)+ RNA was loaded per lane. GAPDH was used as an internal control. (B) Western blot analysis of E-cadherin and β-catenin protein expression in the same conditions. (C) Specificity of 1α,25(OH)2D3 action. Northern blot analysis of E-cadherin mRNA expression in SW480-ADH cells untreated or treated with 10−7 M of the indicated agent or the corresponding vehicles for 48 h. Conditions were as above. (D) Northern blot analysis of the kinetics of induction of E-cadherin mRNA by 1α,25(OH)2D3 in SW480-ADH cells. Times of treatment are indicated. Conditions were as above. (E) Western blot analysis of the kinetics of induction of E-cadherin protein by 1α,25(OH)2D3 in SW480-ADH cells. Times of treatment are indicated. (F) Quantification of the induction by 1α,25(OH)2D3 in SW480-ADH cells of E-cadherin mRNA (•) and protein (○) and of β-catenin mRNA (▪) and protein (□). Fold increase with respect to expression in untreated cells (time 0) is represented. Mean values of three experiments are shown. Quantifications were performed using NIH image software.

