
Figure 6.
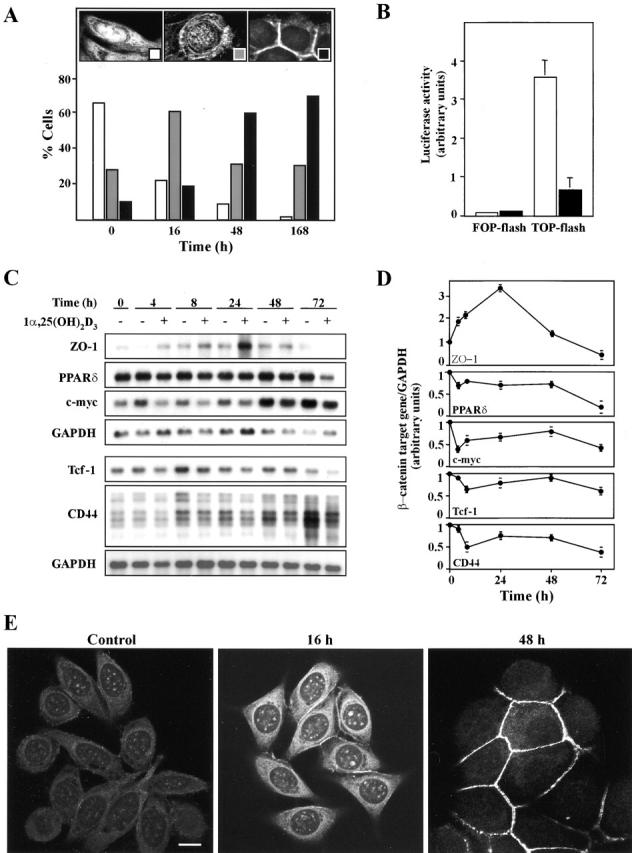
Inhibition of the β-catenin–TCF-4 signaling by 1α,25(OH)2D3. (A) 1α,25(OH)2D3 induces nuclear export of β-catenin. Quantification of the percentage of SW480-ADH cells showing predominant nuclear (left inset, white bars), mixed nuclear-cytoplasmic (middle inset, gray bars), or exclusively membranous (right inset, black bars) β-catenin localization after treatment with 1α,25(OH)2D3 (10−7 M) for the indicated times. 500 cells were analyzed at each time point. (B) Inhibition of β-catenin–TCF-4 transcriptional activity by 1α,25(OH)2D3. SW480-ADH cells were transfected with the wild-type (TOP-flash) or mutated (FOP-flash) β-catenin–TCF4/LEF-1–sensitive reporter plasmids and then left untreated (white bars) or treated (black bars) with 1α,25(OH)2D3 (10−7 M) for 48 h. Mean values and standard deviation of the mean of triplicated obtained in three experiments are shown. (C) Effects of 1α,25(OH)2D3 on the expression of β-catenin–TCF-4 target genes. Northern blots analysis of mRNA expression in SW480-ADH cells untreated or treated with 10−7 M 1α,25(OH)2D3 for the indicated times. Conditions were as above. (D) Quantification of the change in ZO-1, PPARδ, CD44, Tcf-1, and c-myc mRNA levels induced by 1α,25(OH)2D3. Mean values and error bars corresponding to triplicates obtained in three experiments are shown. (E) Induction and redistribution of ZO-1 protein by 1α,25(OH)2D3 treatment. Analysis by immunofluorescence and confocal laser microscopy of ZO-1 expression in SW480-ADH cells after addition of 1α,25(OH)2D3 (10−7 M). Bar, 10 μm.