
Figure 6.
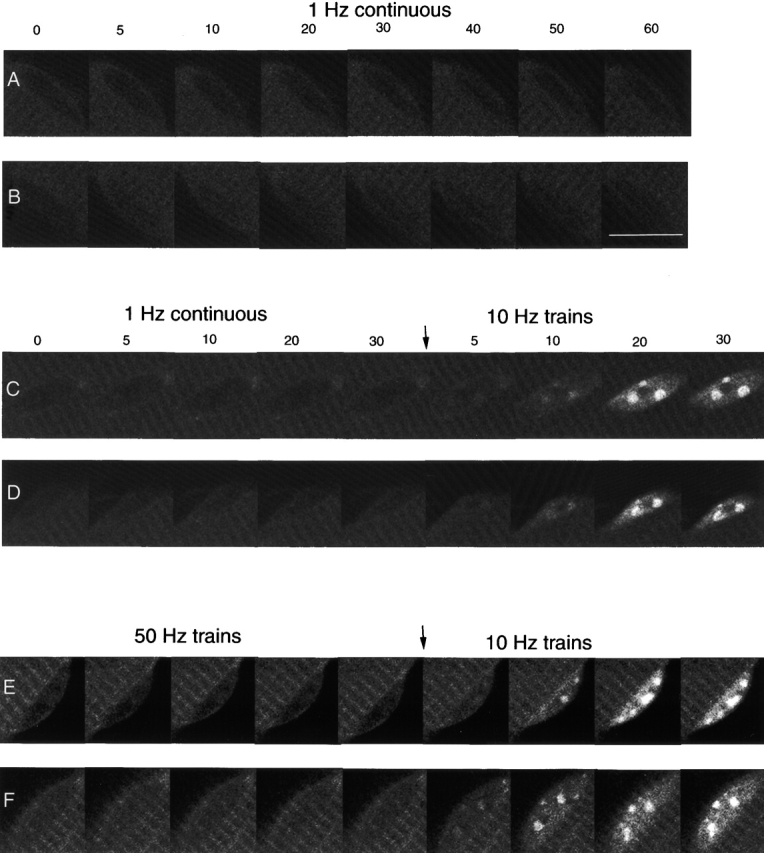
Enlarged images of six nuclei from three different fibers expressing NFATc–GFP and stimulated with different frequencies. (A and B) A fiber was stimulated with 1-Hz pulses for 1 h. (C and D) A fiber was first stimulated with 1 Hz for 30 min, and then the same fiber was stimulated with 10-Hz trains for another 30 min. (E and F) A fiber was first stimulated with 50-Hz trains for 30 min, and then the same fiber was stimulated with 10-Hz trains for another 30 min. Frequencies and time points are labeled, and the time when the stimulation frequency was switched is denoted. Bars, 10 μm.