
Figure 9.
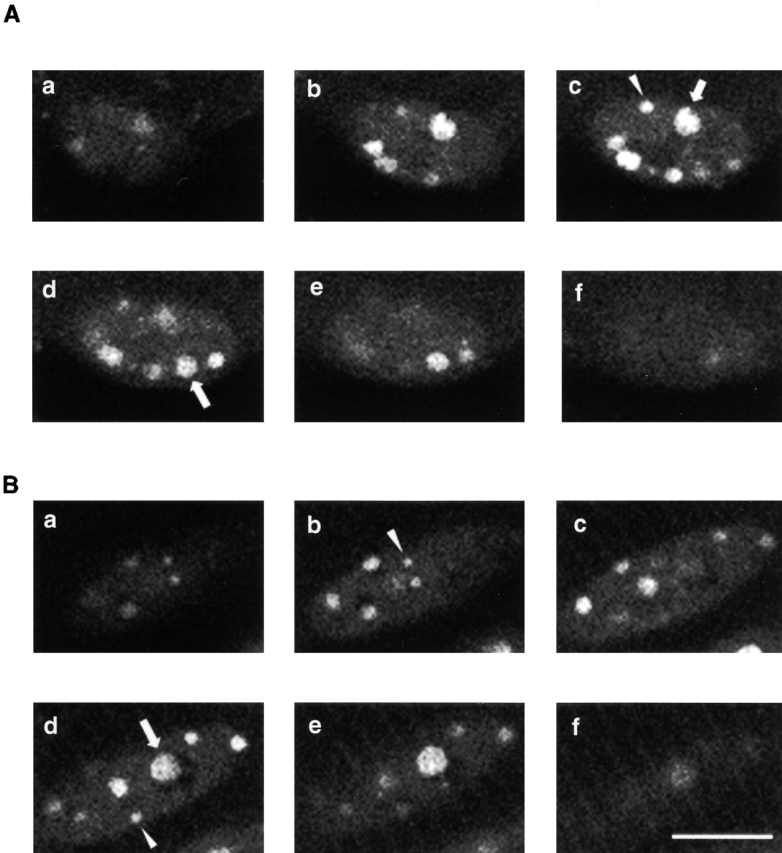
Z-section images of two nuclei from two different living fibers expressing NFATc–GFP, and stimulated for 30 min with 10-Hz pulses continuously. Images a–f in both A and B correspond to successive 1-μm thick sections separated by 1-μm steps in the z-direction. Foci diameters ranged from sub-μm to >2 μm, as denoted with arrowhead or arrow, respectively. Bar, 10 μm.