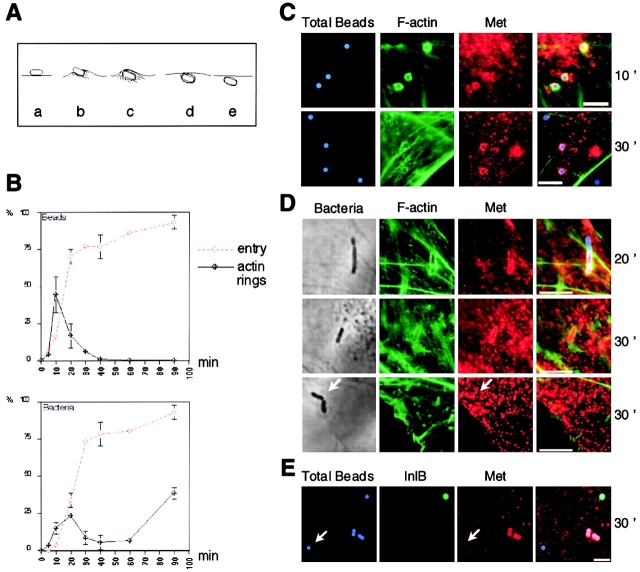
Figure 1.
Actin and Met recruitment during InlB-mediated internalization. (A) Diagram of the internalization process: adherent bacteria (a), formation of the phagocytic cup with actin polymerization (b), phagocytic cup closure (c), disruption of the F-actin cup with residual (d) or no (e) F-actin around the phagosome. (B) Kinetic analysis of F-actin cup formation during InlB-mediated entry. Internalized and F-actin–associated InlB particles were quantified by immunofluorescence at different times after infection. Results are expressed as the percentage of intracellular particles (red dashed line) or the percentage of particles associated with an F-actin ring (black solid line) among the total number of cell-associated particles. (C–E) Met recruitment during InlB bead or bacteria entry at different times after infection. (C) Vero cells were stained with FITC-phalloidin (green) and anti- Met Ab (red). InlB beads are intrinsically fluorescent (blue). (D) Total bacteria associated with cells were visualized in phase–contrast, and bacteria that are fully or partly extracellular were detected by labeling with anti-InlA Ab before cell permeabilization (last panel, blue). (E) Extracellular beads were labeled with anti-InlB Ab (green) before cell permeabilization. Arrows indicate intracellular InlB beads or bacteria not associated with Met. Bars, 5 μm.

