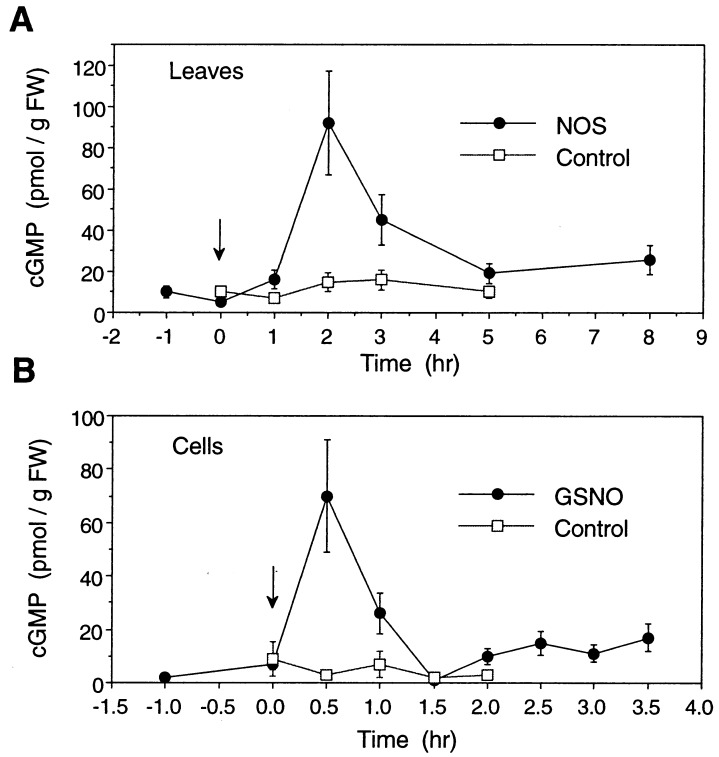
Figure 6.
cGMP levels in NO-treated tobacco leaves and suspension cells. (A) Leaves were infiltrated with NOS as described for Fig. 2, or (B) cells were treated with 350 μM GSNO as described for Fig. 4 (arrows indicate start of treatment). At the indicated times, samples were taken as described (Materials and Methods) and analyzed for cGMP content by a radioimmunoassay. Data represent the mean of two independent experiments, with each time point assayed in triplicate. Standard errors are indicated.

