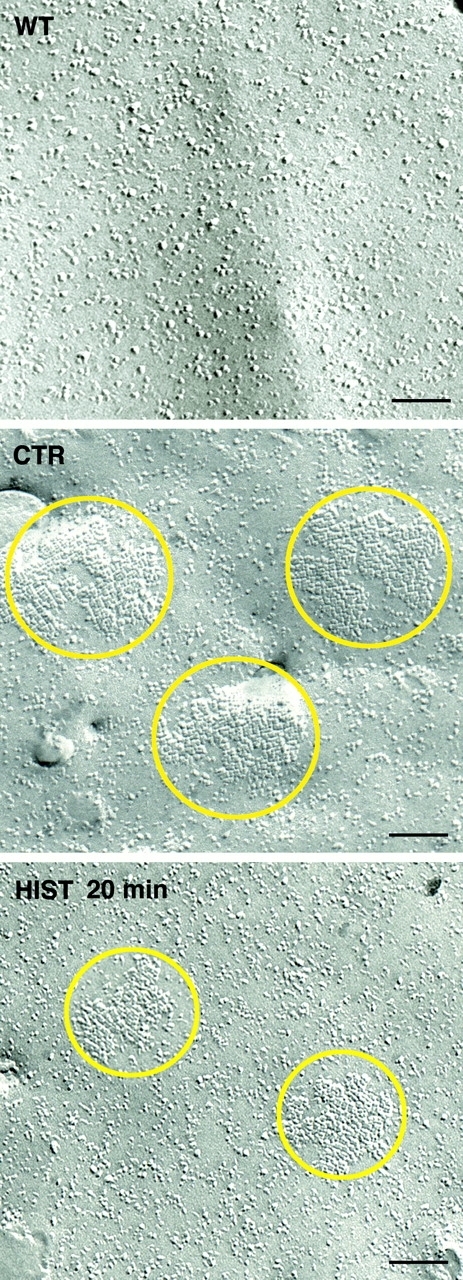
Figure 4.

Freeze-fracture electron micrographs of the plasma membrane of wild-type (WT), control (CTR), and histamine-stimulated 10C1 cells (HIST 20 min). Typical OAPs were visible in the plasma membrane of control 10C1 cells (CTR). After 20 min of histamine stimulation, the density and number of OAPs decreased compared with control (HIST 20 min). Bars, 100 nm.
