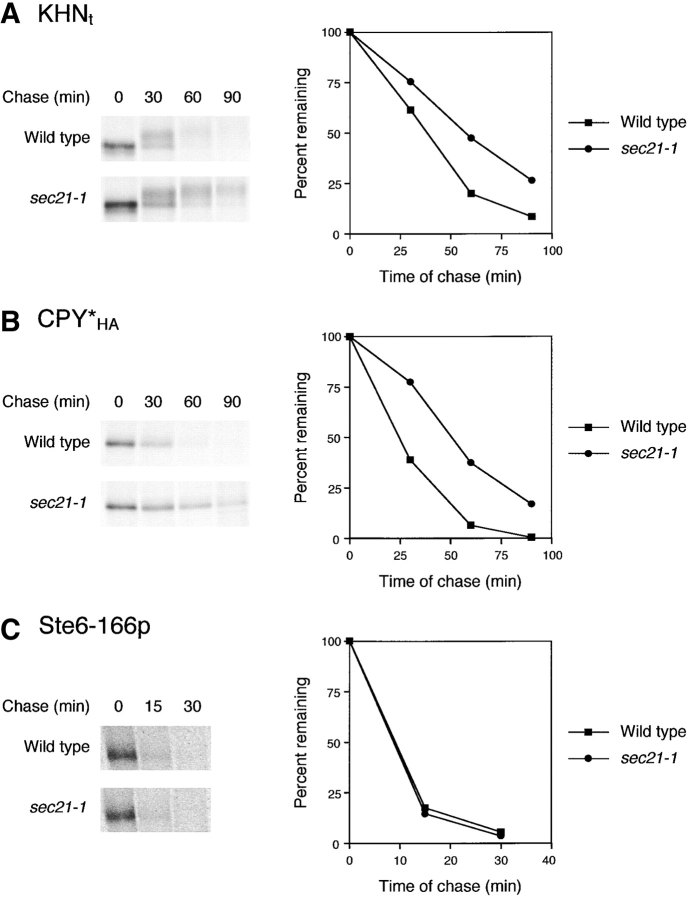
Figure 5.
Degradation of KHN t and CPY* HA but not Ste6–166p requires Golgi-to-ER transport. Pulse–chase analysis was performed on wild-type and sec21–1 strains expressing (A) KHNt, (B) CPY*HA, and (C) Ste6–166p as described in the legend to Fig. 2 except that strains were grown to log phase at 22°C and pulse-labeled immediately after a shift to 33°C. Incubation at 33°C was continued for the cold chase (times as indicated). Gels were visualized by autoradiography (left) and quantified by PhosphorImager analysis (right). In C, the gel images were from PhosphorImager scans.

