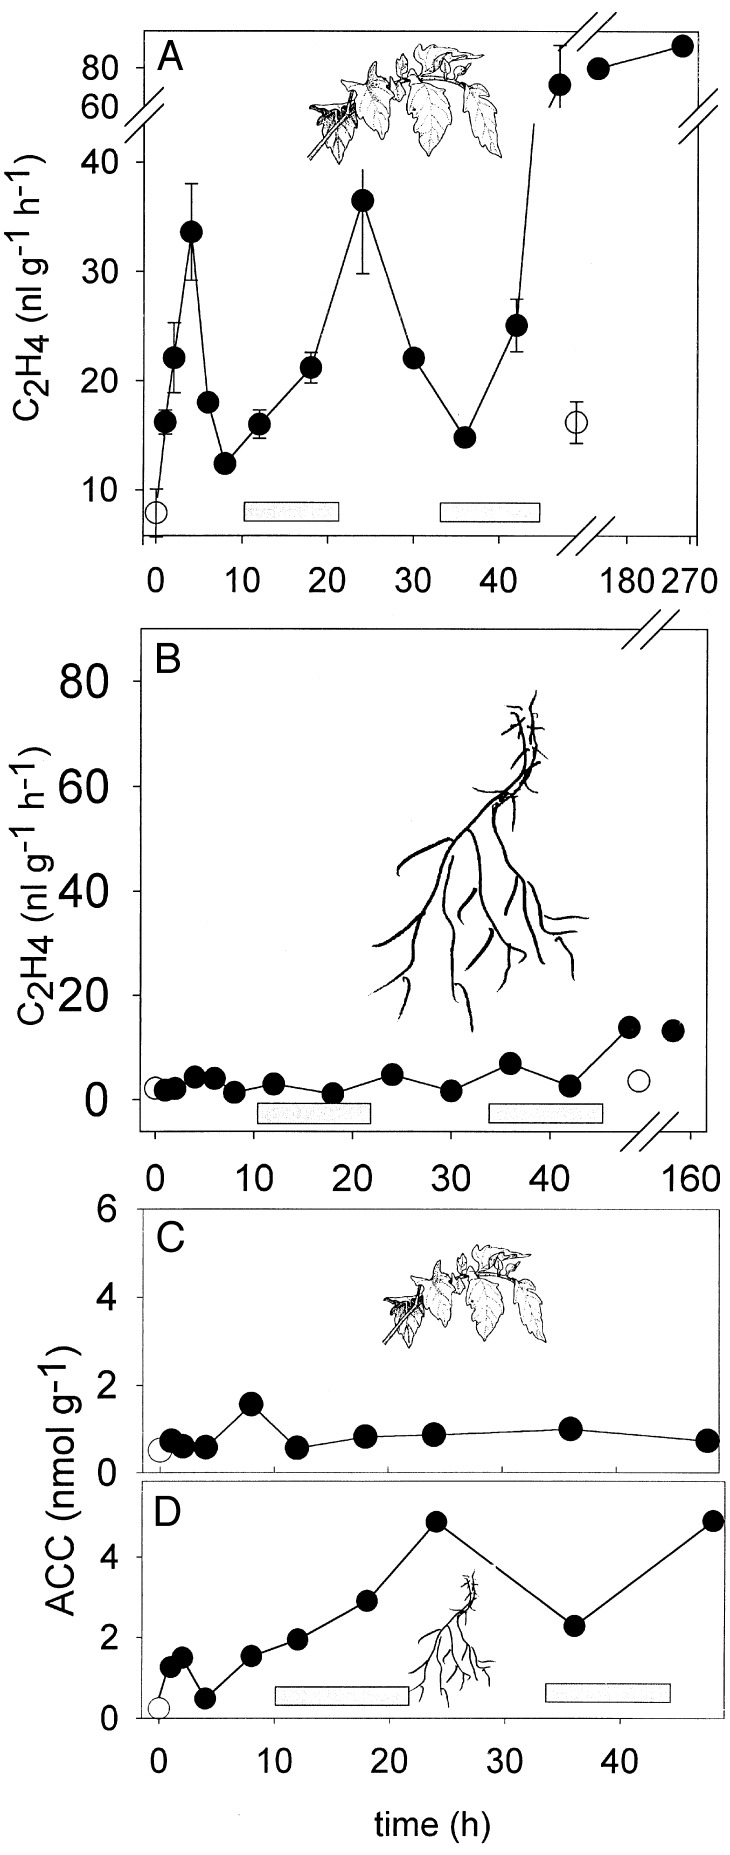
Figure 3.
Ethylene production and ACC content of flooded tomato plants. (A) Ethylene produced by leaves. A break was inserted. Data from two independent experiments were pooled. [Error bars represent SEM (n ≥ 3).] (B) Ethylene produced by roots. (C) ACC content of leaves. The mean of two independent experiments is plotted. (D) ACC content of roots. The mean of two independent experiments is plotted. ○, tissues from unflooded control plants; •, tissues from flooded plants. The dark periods in the green house are symbolized by the shaded bars.

