
Figure 6.
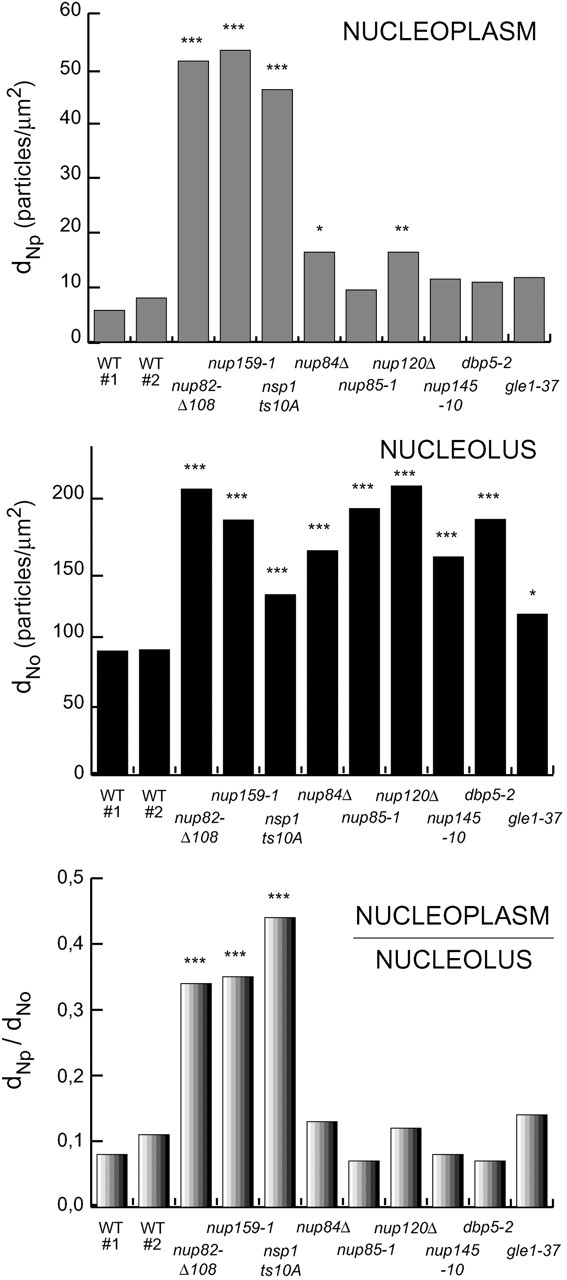
Semiquantitative analysis of the labeling distribution in the nucleolus and the nucleoplasm after in situ hybridization with the 18S probe. Pictures of cells grown at 34°C and prepared as in Fig. 5 were taken randomly; on each picture, the labeling density of the nucleolus (dNo) and of the nucleoplasm (dNp) was evaluated as described in Materials and methods, and the ratio dNo/dNp was calculated. The graph shows the mean values for each strain. A one to one comparison of the mean value of the wild-type strain (FY86) with the others was performed (* P<0.05; ** P<0.01; *** P<0.001). Two independent in situ hybridization experiments were necessary to examine all the strains. The results obtained for the wild-type cells in these two experiments are shown (WT #1 and WT #2).