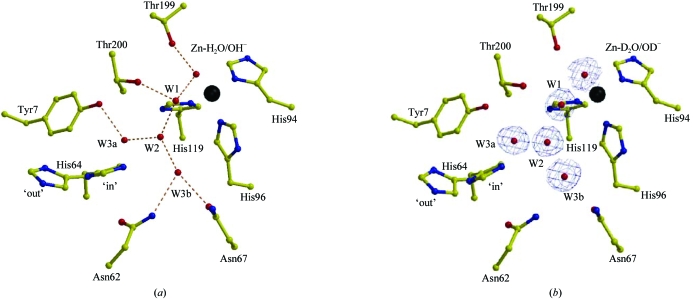
Figure 1.
Active site of (a) hydrogenated and (b) perdeuterated HCA II. Important catalytic side chains in the active sites are shown in yellow ball-and-stick representation and are as labeled. The Zn atom is shown as a black sphere, while solvent molecules are in red. Inferred hydrogen bonds are shown as orange dashed lines. (a) Hydrogenated HCA II (PDB code 1tbt; Fisher et al., 2005 ▶) and (b) perdeuterated HCA II; the blue electron density shown is a 2F o − F c map contoured at 1.5σ. The figure was generated and rendered using MOLSCRIPT and RASTER3D (Esnouf, 1999 ▶; Merritt & Bacon, 1997 ▶).

