Figure 1.
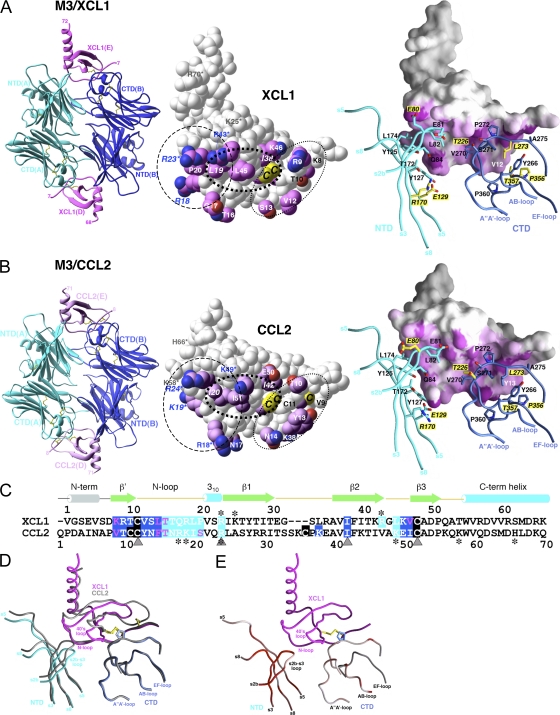
Crystal structures of M3–XCL1 and M3–CCL2 complexes. Structures of (A) M3–XCL1 and (B) M3–CCL2. (left) Each complex displays a 2:2 stoichiometry, with M3 chains labeled A and B and chemokines labeled D and E. (middle) Space-fill models of XCL1 (E) and CCL2 (E). Sidechains of contact residues are highlighted in magenta. Shared chemokine features are circled, with residues in the basic cluster (dashed line) labeled in blue; also shown is the N-terminal segment (dotted line), with residues forming the antiparallel β strand labeled in black, as well as the hydrophobic cluster (bold dotted line). Cysteines of the CC and C motifs are labeled on CCL2 (C11, C12, and C52; note that C36 is not visible) and XCL1 (C11 and C48), respectively. The single disulfide in XCL1 is structurally equivalent to the second disulfide (C12–C52) in CCL2 and is referred to as the invariant disulfide. Conserved sidechain contacts are italicized, and GAG-binding residues are indicated by asterisks (references 35, 38). (right) The chemokine contact surface is highlighted in magenta, with 2.5–3.5-Å (short-range) contacts in a darker shade and 3.5–5-Å contacts in a gradient from magenta to white. M3 sidechain contacts are shown in stick form and labeled, with differential contacts highlighted with yellow labels and noncontacting residues shown in yellow for each structure. (C) Structure-based sequence alignment of XCL1 (1–65) and CCL2 (1–70). All residues that contact M3 NTD or CTD are highlighted in cyan and blue, respectively, with disulfide-forming cysteines in black. Conserved sidechain contacts are indicated by gray triangles and GAG-binding residues with asterisks. (D) Conformational rearrangement of M3 NTD with the Cα trace of M3–CCL2 in gray and M3–XCL1 superimposed in blue, cyan, and magenta. (E) RMSD (all atoms) between M3 in complex with XCL1 and CCL2 is highlighted on the trace of M3–XCL1 as a gradient from white to red (from 0.5 to ≥3 Å). Figures were prepared using Ribbons (reference 67) and GRASP (reference 68) software, as previously described, and the chemokine E chain interface is shown as the reference in all figures.

