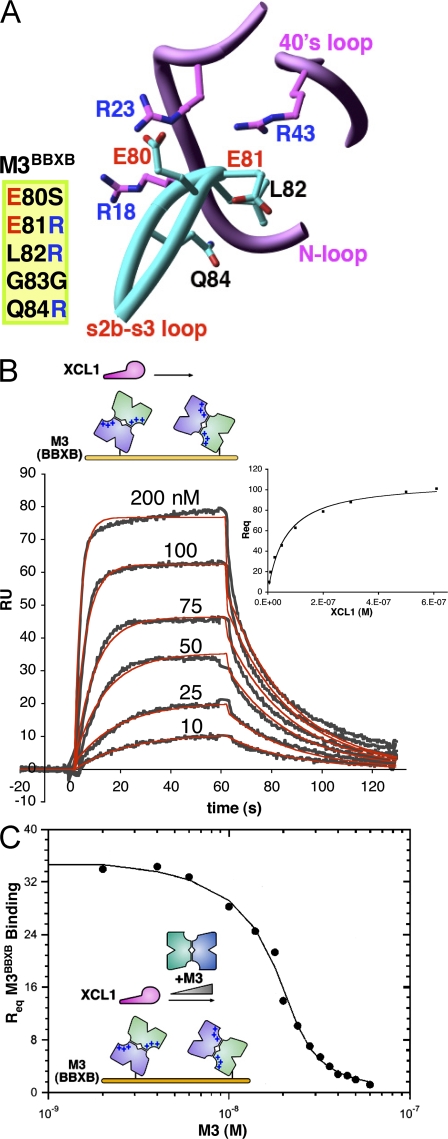
Figure 3.
M3BBXB kinetics and M3 competition assay. (A) Positions mutated in M3BBXB and adjacent basic residues on XCL1 are shown in ball and stick form (oriented as in Fig. 1 A), and mutations are listed. Adjacent sections of the chemokine backbone are not shown, for clarity. (B) XCL1 binding to M3BBXB. Representative sensorgrams (gray) and Req values (plot, inset) are shown with corresponding fits (red and black, respectively; Table IV). (C) Competition assay to determine the solution affinity for M3 binding to XCL1 at 150 mM NaCl. Competition titration curve for coinjected M3 binding to XCL1 in competition with immobilized M3BBXB is shown with a corresponding fit to the data (Table IV).

