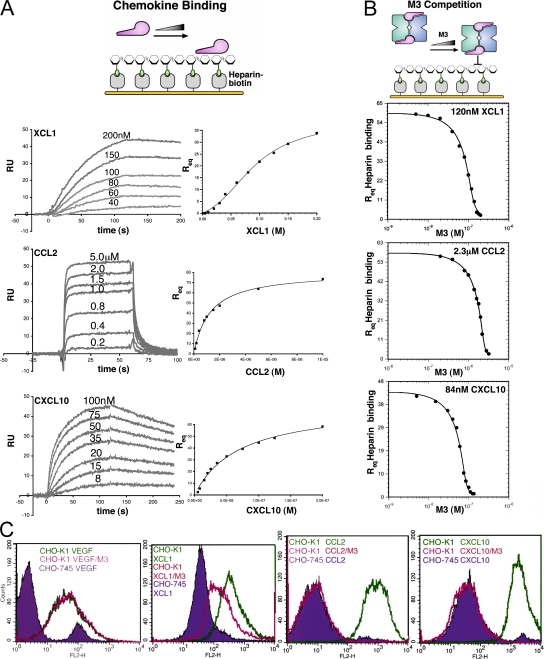
Figure 4.
Heparin-binding and M3 competition assays. (A, left) Representative SPR traces for chemokines binding to immobilized heparin. Note that chemokines display multiphasic-binding kinetics, which therefore precluded kinetic analysis using a simple bimolecular interaction model. (right) Req values for chemokine binding to heparin with corresponding nonlinear fits to obtain KD for each interaction (Table V). Equilibrium (Req) binding for CCL2 and CXCL10 was described well by a simple 1:1 interaction model; however, XCL1 displayed cooperative binding behavior and, thus, a more complex model was used (Supplemental materials and methods). (B) Competition titration curves with corresponding fits for coinjected M3 inhibition of XCL1, CCL2, and CXCL10 binding to immobilized heparin (Table V). (C) FACS analysis of chemokine binding to CHO-K1 (wild-type) and CHO-745 (GAG-deficient) cell lines. Staining of CHO-745 cells is shown in violet for XCL1, CCL2, CXCL10, and VEGF control, with staining in the absence (green) and presence (magenta) of M3 superimposed.

