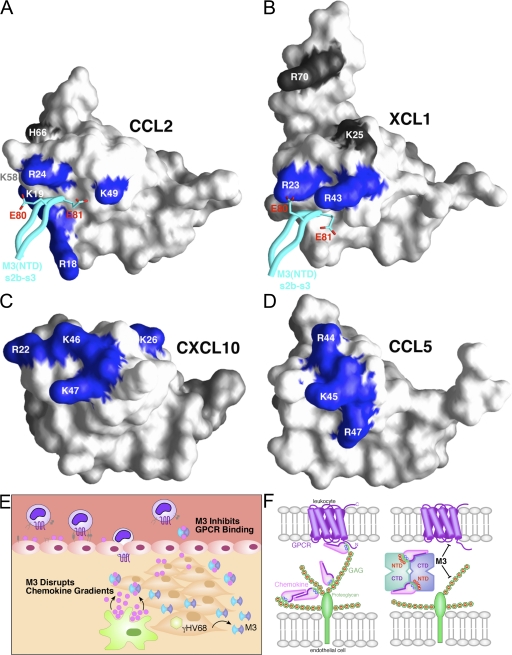
Figure 5.
Dual GPCR and GAG inhibition by M3. (A) Surface representation of CCL2 is shown, with previously identified GAG-binding residues labeled (references 35, 44). Four out of the six residues defined by mutational analysis as creating the GAG-binding epitope of CCL2 are directly contacted by M3 and are colored blue (Arg18, Lys19, Arg24, and Lys49), whereas the noncontacted residues are colored gray (Lys58 and His66). The M3 NTD s2b-s3 loop is displayed in cyan, with acidic contact residues E80 and E81 shown in stick form. (B) M3 contacts two out of the four previously identified GAG-binding residues of XCL1 (R23 and R43, blue; K25 and R70, gray; reference 38). (C) The structure of human CXCL10 (reference 70) is shown, with the four conserved GAG-binding residues identified by mutational analysis in mouse IP-10 highlighted in blue (R22, K26, K46, and K47; reference 45). (D) The structure of CCL5 is shown, with GAG-binding residues established by structural and mutational analysis highlighted in blue (R44, K45, and R47; references 46, 47). (E) Proposed model for the disruption of chemokine gradients by M3 during MHV68 infection. (F) Schematic of M3 NTD-mediated disruption of chemokine interactions with cell-surface GAGs (green) and CTD-mediated disruption of chemokine interactions with GPCRs (violet). The electrostatic potential is indicated by red (+) and blue (−) on chemokines and GAGs, respectively.

