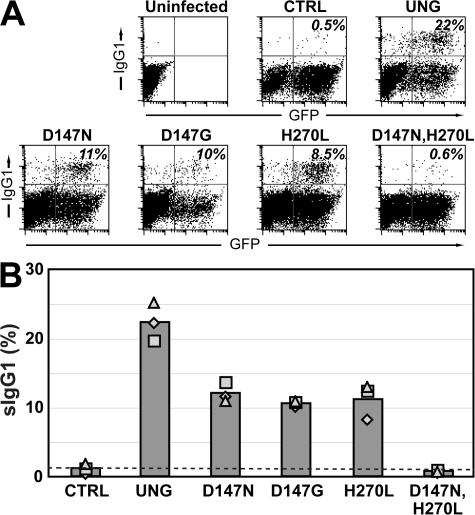
Figure 2.
Class switching in ung−/− msh2−/− B cells after retroviral delivery of mutant UNGs. (A) Representative flow cytometric plots presented as described in the legend to Fig. 1 B. (B) Compilation of the results of three separate experiments represented by the different symbols, with the bars representing the averages. Switching by all the UNG mutants differs significantly from that achieved with the wild-type enzyme (P < 0.05).

