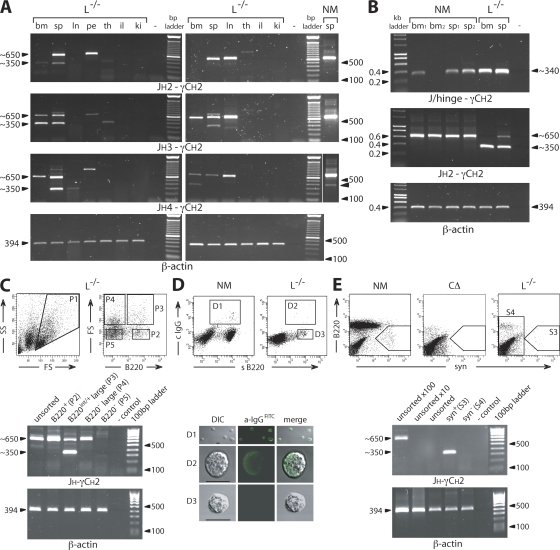
Figure 4.
Identification of cells that generate H chain products. (A) RT-PCR amplification from JH2, JH3, or JH4 to γCH2 using RNA prepared from total bone marrow (bm), spleen (sp), lymph nodes (ln), peritoneum (pe), thymus (th), ileum (il), and kidney (ki) cells from two L−/− mice and spleen from a normal mouse (NM). γ H chain bands of reduced size (∼350 bp; arrowhead indicated in NM) are present in lymphoid tissue, sometimes accompanied by the full-size product (∼650 bp). β-Actin served as a reference (25 cycles). The thin white line indicates where the original gel was spliced. (B) RT-PCR amplification of bone marrow (bm) and spleen (sp) from normal and L−/− mice using a J/hinge oligo, specific for J to hinge joins that lack CH1 (JH1, JH2, or JH4 and γ2a or γ2b), in combination with the γCH2c oligo. In comparative control reactions, JH2 to γCH2a and β-actin (21 cycles) was amplified. (C) For the analysis of spleen cells by FACS and RT-PCR from L−/− mice, the lymphocyte gate established by FS and SS was set to include large cells (P1). These cells were collected (P2–P4) according to their staining profiles for B220. Large B220+ cells (P3) show a γ H chain RT-PCR band, from JH4 to γCH2, of reduced size (∼350 bp) lacking CH1, whereas other cell fractions contain a normal-size H chain transcript (∼650 bp). PCR reactions were normalized using β-actin. (D) Surface staining for B220 and cytoplasmic staining for IgG showed in confocal images that H chain antibody–producing B cells are of larger size (D2). DIC, differential interference contrast. Bars, 10 μm. (E) Surface staining for syndecan (syn; CD138) identified a population (S3) only expressing H chain transcripts without CH1 in L−/− mice. Syn+ cells from NM, which are lacking in CΔ mice, established the gate for the cell sort. Normalized RT-PCR reactions (32 cycles) were performed with the sensitivity and specificity being verified by increased levels of unsorted spleen cells (10× and 100×). Control reactions without DNA (−) are indicated. The data are representations using different mice in at least three independent experiments giving very similar results.

