Figure 1.
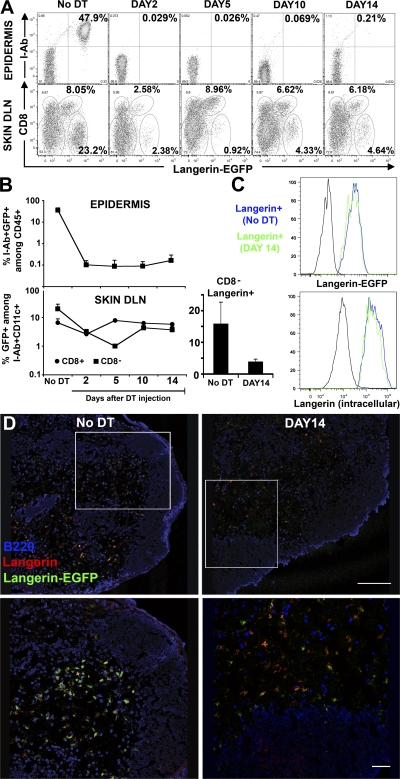
Kinetics of langerin+ repopulation in the epidermis and in skin DLNs. 6–8-wk-old Langerin-DTR/EGFP mice received a single intraperitoneal injection of DT (1 μg) and the kinetics of reappearance of langerin+ was followed by flow cytometry in the epidermis and the skin DLNs at different time points after depletion (Fig. S1). (A, top) Dot plots show I-Ab and langerin expression (EGFP) among living (DAPI−) CD45+ cells in the epidermis at different times after DT treatment. The remaining CD45+I-Ab−langerin-EGFP− cells represent dendritic epidermal T cells (DETC). (A, bottom) The percentage of cells expressing CD8 and langerin among DAPI−CD11c+I-Ab+ DCs is shown for skin DLNs. (B) Graphs in log scale present the kinetics of reappearance of LCs in the epidermis and CD8−langerin+ (▪) versus CD8+langerinlo (•) in the skin DLNs. Mean values (± the SD) are shown. (right) Histogram shows the percentage of CD8−langerin+ (mean values ± the SD) among CD11c+I-Ab+ cells before and after DT treatment (DAY14). (C) Overlaid histograms show the langerin levels of expression measured either by EGFP fluorescence (top) or langerin intracellular staining (bottom) in skin DLN CD11c+I-Ab+ CD8− langerin+ cells before and after DT treatment (DAY14). C57BL/6 control and isotype control are shown in black for Langerin-EGFP or langerin intracellular staining, respectively. Representative data from three independent experiments are shown. Each experiment included at least three separately analyzed mice per time point; error bars represent the SD between the results obtained from each of the three mice. (D) Double immunostaining (B220 in blue and langerin in red) of skin DLNs from Langerin-DTR/EGFP (Langerin-EGFP in green) before and after DT treatment (DAY14). Fig. S1 is available at http://www.jem.org/cgi/content/full/jem.20071733/DC1. Bars: (top) 200 mm; (bottom) 50 mm.

