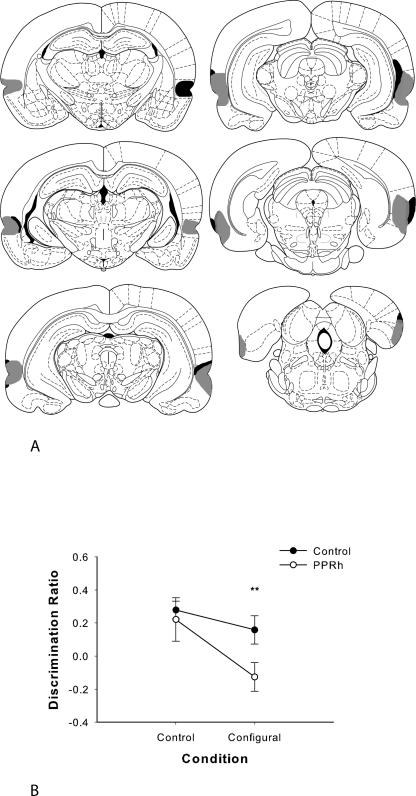
Figure 3.
(A) Coronal sections illustrating the extent of the largest (gray) and smallest (black) lesions of the perirhinal and post-rhinal cortex in experiments 2 and 3, from −3.14 to −8.72 mm posterior to bregma. Reprinted from Paxinos and Watson (1998), with permission from Elsevier © 1998. (B) Performance on minimal delay configural object recognition (experiment 2). Data are presented as average discrimination ratio ± SEM. *P < 0.05.

