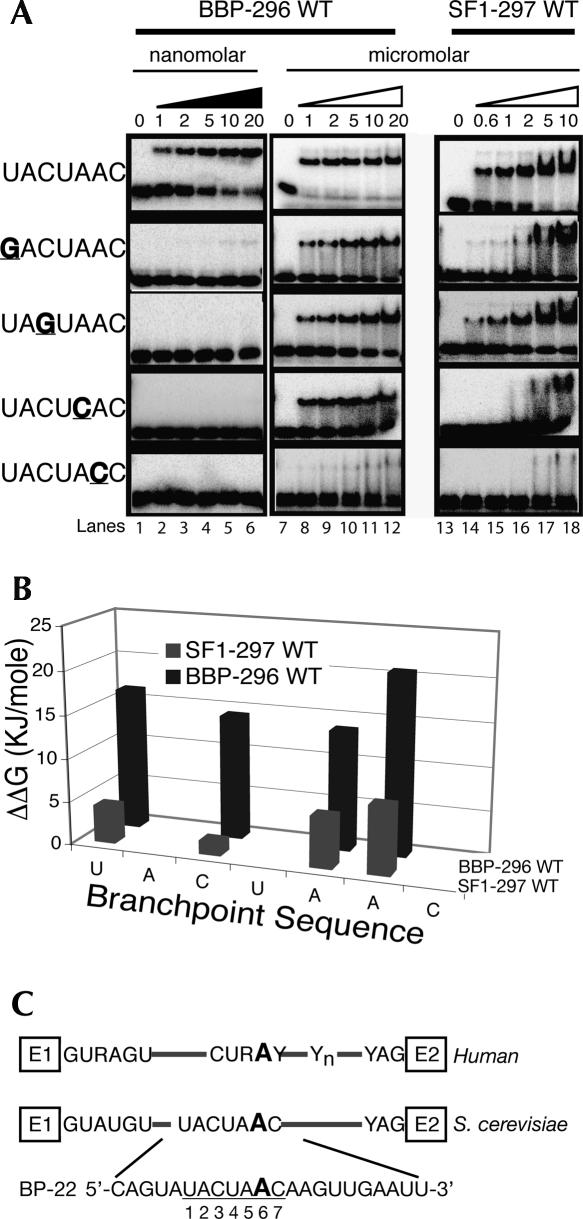
FIGURE 1.
A quantitative comparison of the RNA binding specificity of BBP and SF1. (A) Binding to the BP-22 RNA is shown in the top row of the gels. BP-22 RNA contains the wild-type branchpoint sequence and is labeled on the left as UACUAAC. Binding to the mutant RNAs are below the wild-type UACUAAC and labeled on the left. Point mutations are underlined and in bold. Concentrations are listed underneath the triangles. (Lanes 1–6) Binding to BBP-296 in the low nanomolar range, (black triangle). To determine Kds for the mutant RNAs, binding in the micromolar range (white triangle) was required (lanes 7–12). (B) A bar graph comparing the specificities measured in ΔΔG for the point mutations tested in A with BBP and SF1. (C) A schematic of yeast and human introns are shown with the BP-22 RNA sequence used in these studies shown at the bottom. The branchsite adenosine used as the nucleophile in the first step of chemistry is underlined and in a larger font.

