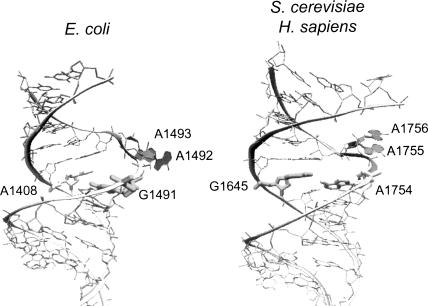
FIGURE 6.
Comparison of prokaryotic and eukaryotic decoding sites. Structures of RNA fragments containing the E. coli (left) or S. cerevisiae and H. sapiens (right) decoding sites are shown. The two nonconserved residues (A1408 and G1491 in E. coli; G1645 and A1754 in S. cerevisiae) are highlighted. The conserved adenines (A1492 and A1493 in E. coli; A1755 and A1756 in S. cerevisiae) are filled and shown in the flipped-out conformation (see text for details). PDB files used to model these structures are 1J7T (left) and 2FQN (right).

