Figure 2.

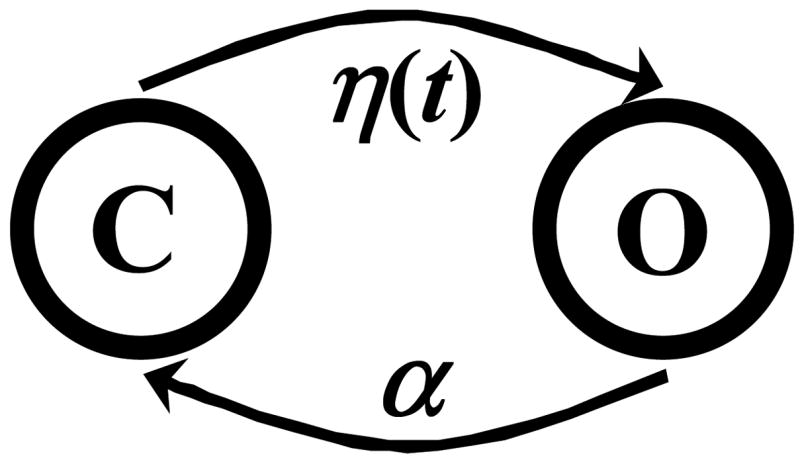
Schematic representation of the nonstationary Markov model. C is the closed state and O is the open state. η(t) is the transition rate from closed to open state at time t and α is the transition rate from open to closed state at any time.

Schematic representation of the nonstationary Markov model. C is the closed state and O is the open state. η(t) is the transition rate from closed to open state at time t and α is the transition rate from open to closed state at any time.