
Figure 2. Activation maps.
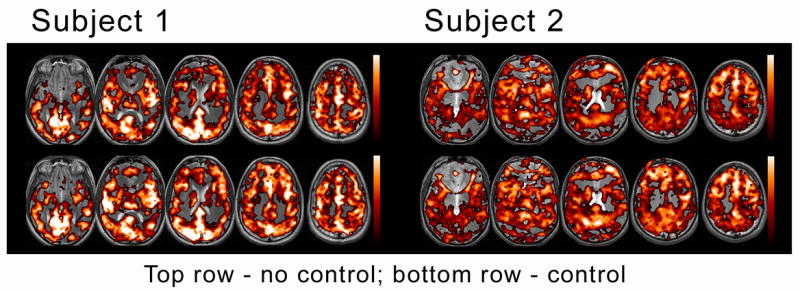
BOLD response for two representative subjects is displayed for no-control and control scans. Greater overall magnitude and extent was demonstrated in the controlled feedback scans (bottom rows).
Official websites use .gov
A
.gov website belongs to an official
government organization in the United States.
Secure .gov websites use HTTPS
A lock (
) or https:// means you've safely
connected to the .gov website. Share sensitive
information only on official, secure websites.
BOLD response for two representative subjects is displayed for no-control and control scans. Greater overall magnitude and extent was demonstrated in the controlled feedback scans (bottom rows).