
Figure 5. BOLD variability.
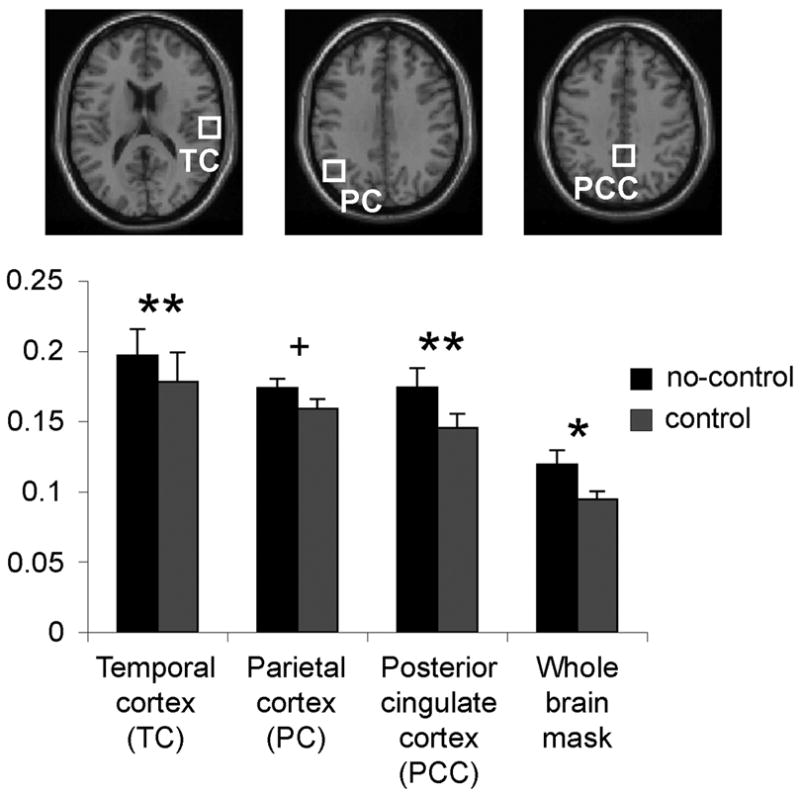
Variance in physiological BOLD data was normalized to obtain normalized variance or yfluc = σresid/ypp. For controlled feedback scans, variability was significantly reduced (**p ≤ 0.001; *p ≤ 0.01; + n.s. trend p = .07) as compared to scans in which subjects received no feedback cuing target inspiration depth.