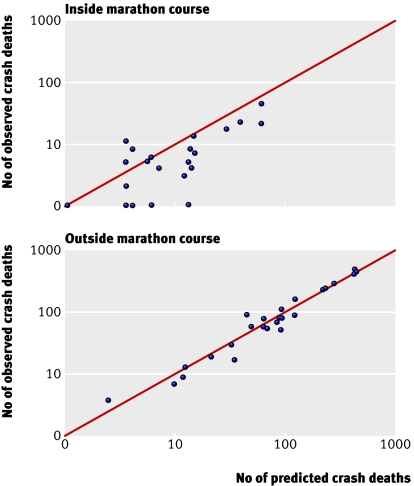
Fig 2 Comparison of observed crash fatalities on marathon days relative to predicted crash fatalities on control days. Top: counties inside marathon route; bottom: counties outside marathon route and data from corresponding hours of road closures. Each point represents one marathon site summed over all years. Note logarithmic scale and zero values plotted at 1

An official website of the United States government
Here's how you know
Official websites use .gov
A
.gov website belongs to an official
government organization in the United States.
Secure .gov websites use HTTPS
A lock (
) or https:// means you've safely
connected to the .gov website. Share sensitive
information only on official, secure websites.
