
Figure 5.
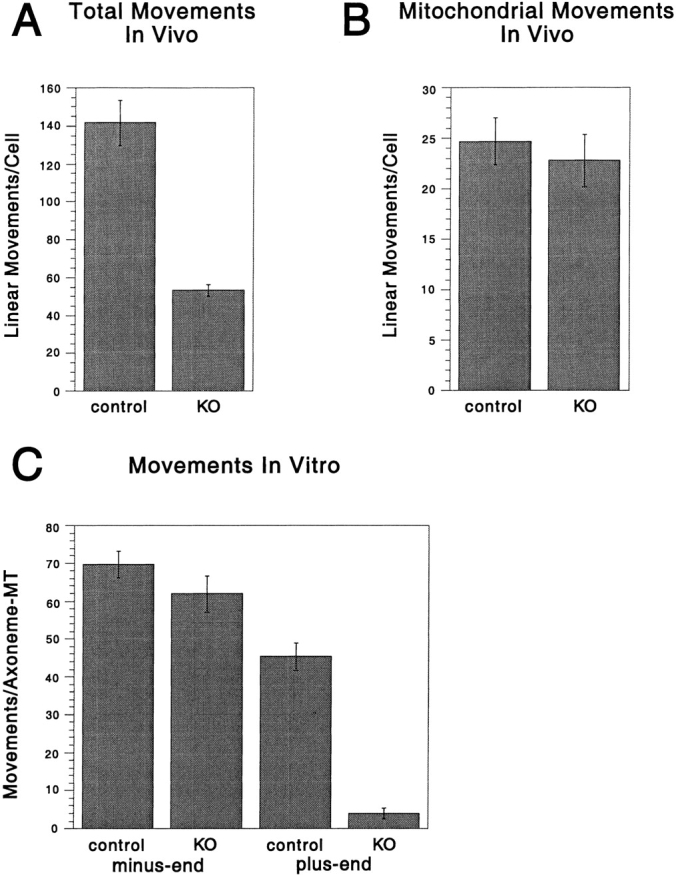
The DdUnc104 null cell line has in vivo and in vitro defects in organelle transport. (A) In vivo movements in control and null cells (from Fig. 4) were observed by differential interference contrast microscopy. Only linear and continuous movements >1 μm in length were scored, and each cell was observed for 4 min. The total number of movements per cell was averaged over all cells observed (values shown are the mean ± SEM; n = 10 cells for each cell type). The number of movements was significantly reduced in the null cells (KO, knockout) relative to the control cells (t test; P < 0.001). (B) In vivo movements of mitochondria labeled with a mitochondrial dye (Mitotracker) were observed by fluorescence microscopy. Only linear and continuous movements of >1 μm were scored, and each cell was observed for 1 min. The total number of movements per cell was averaged over all cells observed (values shown are the mean ± SEM; control, n = 27 cells; null, n = 22 cells). There was no statistically significant difference in the control and null means by t test. (C) ATP releasates were prepared from the control and null cells and combined with KI vesicles in our in vitro assay (see Materials and Methods), and minus- and plus-end–directed vesicle movements were scored. Multiple 4-min assays were performed on each of two separate ATP release preparations for each cell line, and the results for all assays were averaged (values shown are the mean ± SEM; control, n = 6 assays; null, n = 8 assays). The number of plus-end–directed movements was significantly reduced in the null cells relative to the control (t test; P < 0.001), while the levels of minus-end–directed movement were statistically equivalent by t test.