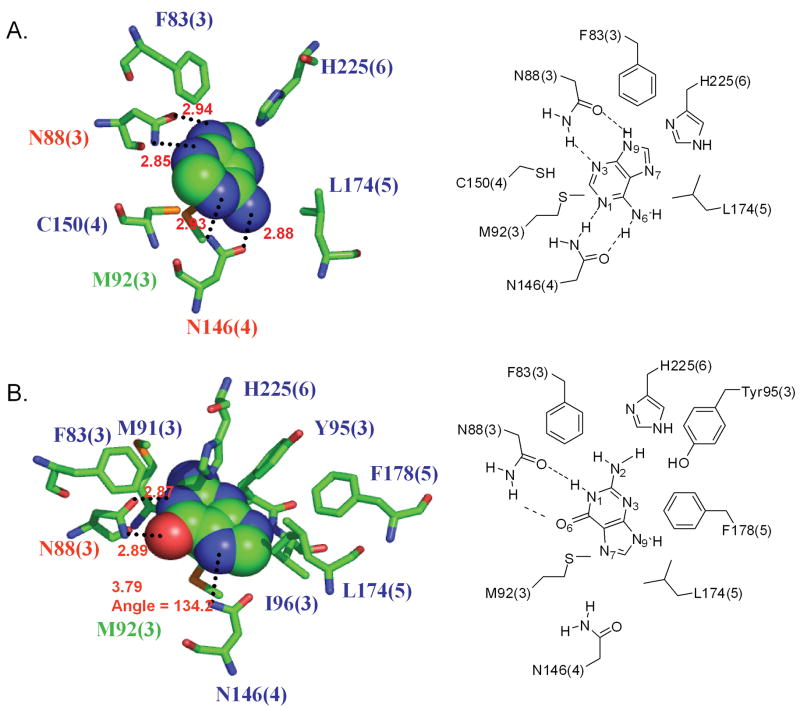
Figure 5.
The predicted binding pockets of adenine (top) and guanine (bottom) in the rMrgA receptor. All residues within 5 Å from the bound ligand are shown. The residue labels are colored according to the binding energy contributions from non bond interaction with the ligand:
red: more favorable than -10 kcal/mol contribution (best),
green: between -10 and -4 kcal/mol,
blue: less favorable than -4 kcal/mol (worst).
The hydrogen bonds are indicated by dotted lines with the distance between the donor and acceptor atoms. The number in parenthesis indicates the TM segment containing the residue.

