
Fig. 2.
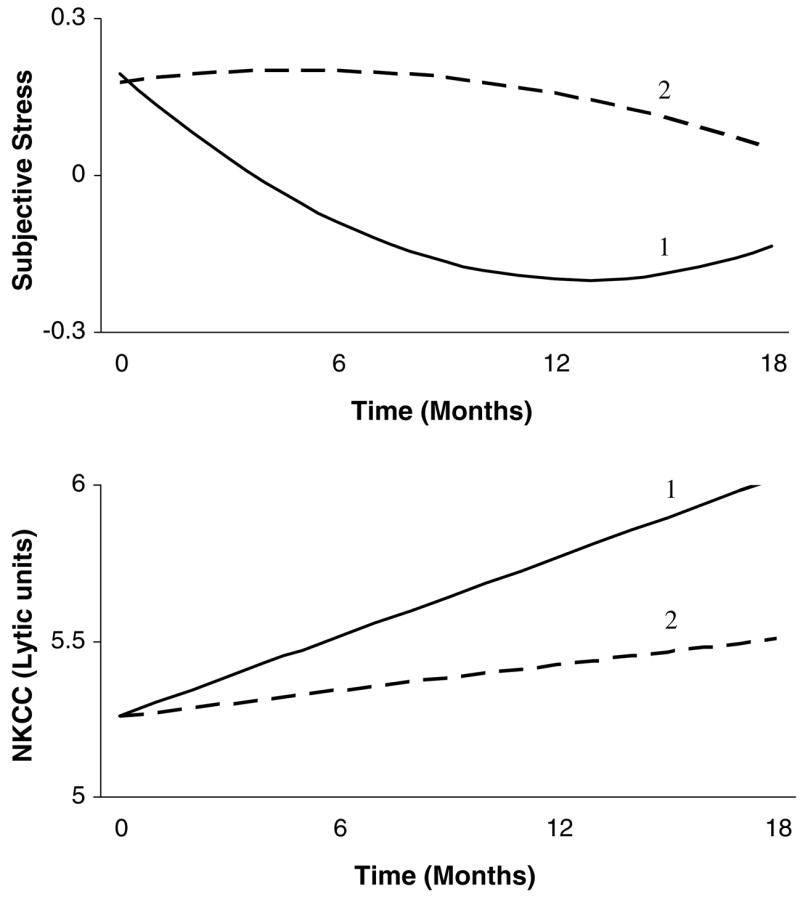
Graphical representation of the relationship between subjective stress and natural killer cell cytotoxicity (NKCC), as revealed by the latent growth curve model. Pattern 1 reflects the group mean trajectory for subjective stress. Corresponding NKCC is also at the group mean. Results suggest that a slower rate of decline in stress is accompanied by a slower rate of increase in NKCC. Therefore, Pattern 2 reflects a trajectory in which rate of change in stress (Subjective Stress Slope) is one standard deviation above the mean. Change in the curvature of the line accompanies this change in rate of change, because Subjective Stress Slope correlates with Subjective Stress Quadratic. For Pattern 2, rate of change in NKCC is predicted to be lower.