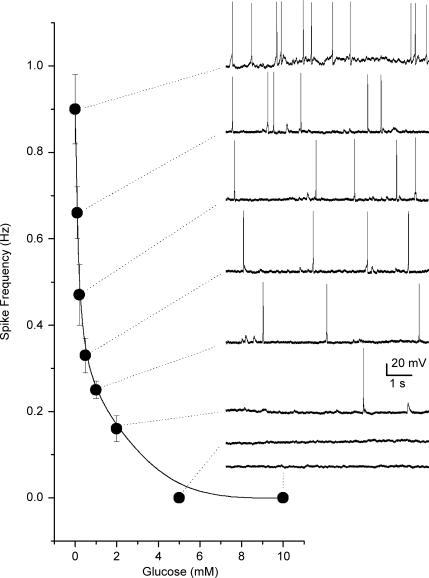
Figure 1.
Dose–response curve showing relation between glucose concentration and sensory discharge from a cocultured petrosal neurone This neurone formed a functional chemosensory unit with an adjacent type I cell cluster as indicated by an increase in spike discharge during hypoxia (not shown). Spike discharge also increased in a dose-dependent manner following a decrease in glucose concentration as illustrated in the diagram. Data points represent mean (± s.e.m.) spike frequency estimated from 3 to 4 10 s recording segments at each glucose concentration. Sample traces of spike discharge are illustrated on the right for the corresponding glucose concentration; resting potential was ∼–58 mV. Recordings were obtained in bicarbonate/5% CO2-buffered medium at normoxic PO2 (140 mmHg).

