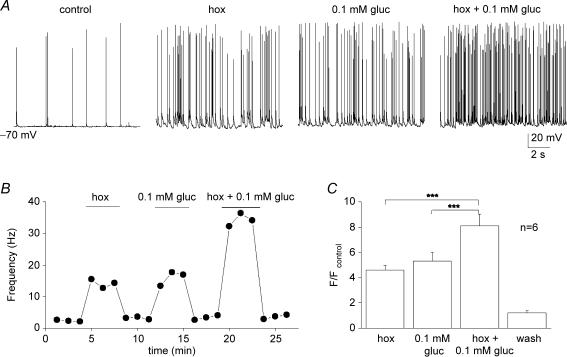
Figure 4.
Interaction between low glucose and hypoxia on sensory discharge A, sample traces showing effects of hypoxia (hox; PO2 ≈ 5 mmHg), 0.1 glucose (PO2 ≈ 140 mmHg), and hypoxia plus 0.1 mm glucose, on chemosensory discharge recorded in a cocultured neurone. Corresponding time series plot of discharge frequency is shown for the same neurone in B. Note additive interaction between hypoxia and low glucose in B, and for a group of 6 similar cocultured neurones in C. Data in C are plotted as spike frequency (F) ratio relative to control (Fcontrol), where Fcontrol is frequency recorded in 10 mm glucose/PO2 ≈ 140 mmHg; significant differences indicated by ***P < 0.001.

