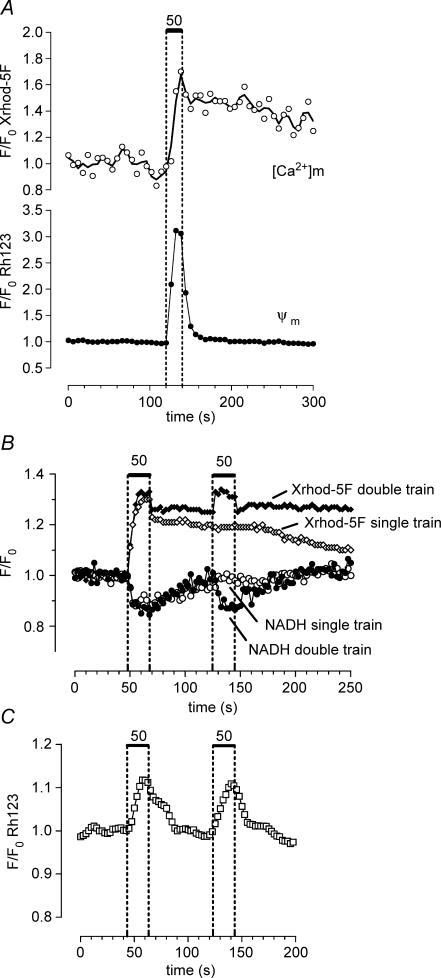
Figure 4.
The stimulation-induced depolarization of Ψm and decrease in NADH fluorescence return to baseline faster than the increase in matrix [Ca2] Changes in matrix [Ca2+] were measured using Xrhod-5F loaded into the mitochondrial matrix as described in the Methods. A, changes in mitochondrial [Ca2+] (upper trace) and Ψm (lower trace) recorded simultaneously from the same motor terminal (n = 2 experiments). B, sequentially recorded changes in NADH fluorescence (circles, lower traces) and matrix [Ca2+] (diamonds, upper traces) recorded from another terminal. Responses to a single 20 s train (open symbols) and two sequential 20 s trains (filled symbols) are superimposed. C, changes in Rh123 fluorescence recorded from a different terminal following a two-train stimulation pattern as in B. In A the stimulation-induced increase in Rh123 fluorescence was greater than that illustrated other figures. A likely explanation for this is that in this terminal the regions of interest in which Rh123 fluorescence was analysed were defined as those regions that showed a stimulation-induced increase in Xrhod-5F fluorescence. This procedure improved the spatial resolution and consequently the signal-to-noise ratio of the Rh123 signal by reducing the amount of Rh123 fluorescence recorded from non-responsive regions. In B the prolonged poststimulation plateau of Xrhod-5F fluorescence was not due to saturation of the indicator, but rather to the powerful matrix buffering system described in the text. In B the NADH records were collected first, then the mitochondrial matrix was loaded with Xrhod-5F; the small, rapid initial decay in Xrhod-5F fluorescence following each stimulus train may have arisen from a small amount of Xrhod-5F remaining in the cytosol.

