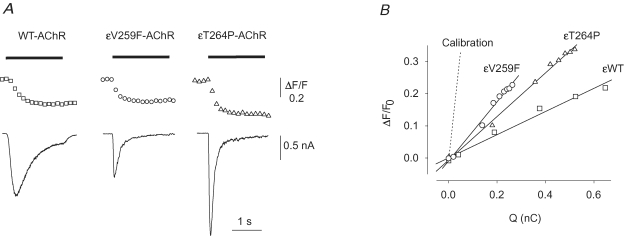
Figure 2.
Calcium fractional current of WT and mutant AchRs A, typical fluorescence (top trace) and current (bottom) responses to nicotine (100 μm, horizontal bar) simultaneously recorded in cells expressing the indicated AChR. Notice the large Ca2+ response recorded in the εV259 cell in spite of a relatively small current. B, linear fit of the ΔF/F0versus Q in the same three cells as in A. The dotted line represents the averaged slope of the calibration experiments. ^, εV259F-AChR; ▵, εT264P-AChR; □, WT-AChR, as indicated.

