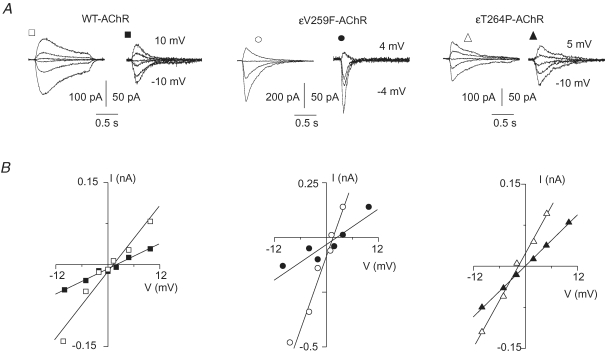
Figure 3.
Relative Ca2+ permeability (PCa/PCs) of WT and mutant AchRs A, ensemble whole-cell currents recorded in response to ACh (10 μm) applied at various test potentials with low extracellular Ca2+ (1 mm, open symbols) or high extracellular Ca2+ (10 mm, filled symbols), in transfected cells expressing the indicated AChRs. In each panel, numbers refer to the most positive and negative test potentials shown. Note the reduction of current amplitude in high Ca2+ for all the AChR isoforms. B, current peak amplitude plotted versus membrane test potential in the same cells as in A. Lines represent the linear fit of each data group. Note positive shifts of current reversal potentials (0.7 mV for WT-AChR; 1.5 mV for εV259F-AChR; 1.6 mV for εT264P-AChR) at 10 mm Ca2+ (filled symbols).

