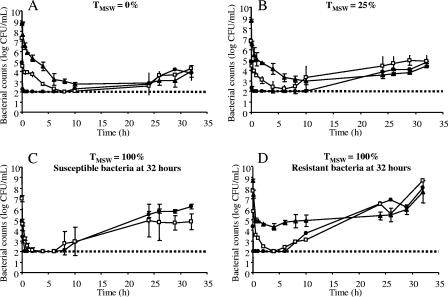
FIG. 1.
Observed viable counts of Escherichia coli ATCC 25922 following exposure of initial inoculum sizes of 105 (•), 107 (□), or 109 (▴) CFU/ml to concentrations of marbofloxacin inside the MSW for 0% (A), 25% (B), or 100% (C and D) of the time. For a TMSW of 100%, experiments in which surviving bacteria were mainly susceptible to a marbofloxacin concentration of 0.128 μg/ml are represented in panel C, and those in which surviving bacteria were mainly resistant to 0.128 μg/ml are shown in panel D. (A, B, and C) Each symbol represents the mean of results from two experiments. (D) The symbols • and □ represent results of a single experiment, and the symbol ▴ represents the mean from three experiments. Error bars show standard deviations. The dotted line indicates the lower limit of detection (2 log10 CFU/ml) used for bacterial quantification.

