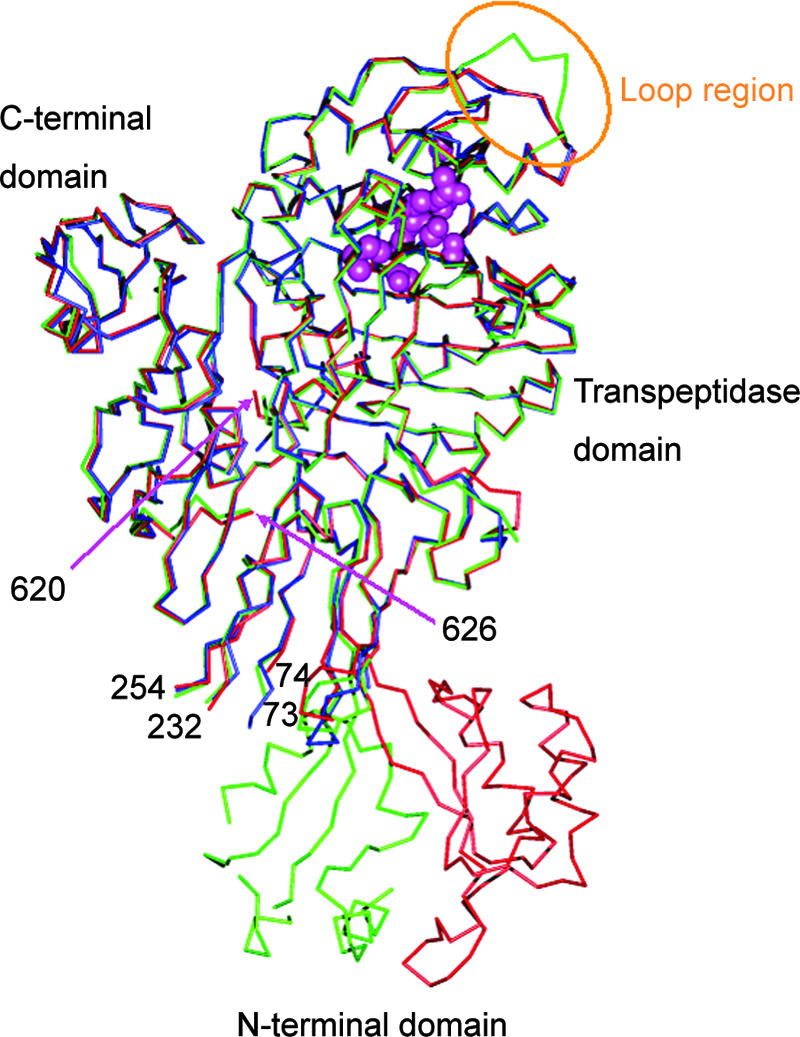
FIG. 2.

Structural comparison between the trypsin-digested PBP 2X and the soluble PBP 2X from S. pneumoniae. The Cα models of molecule 1 (residues 74 to 232, 254 to 620, and 626 to 750) and molecule 2 (residues 73 to 101, 113 to 120, 133 to 169, 173 to 232, 254 to 620, and 626 to 750) of the trypsin-digested PBP 2X are colored red and green, respectively. The Cα model of the soluble PBP 2X (residues 71 to 92, 183 to 232, 254 to 620, and 632 to 750) is colored blue, with spheres (in magenta) representing side chains in the conserved motifs (337STMK, 395SSN, and 547KSG). The residue numbers of amino acids near the trypsin digestion sites are also shown. The loop region (residues 376 to 386), which assumes a different conformation in molecule 2 of the trypsin-digested PBP 2X, is indicated by an ellipse (yellow).
