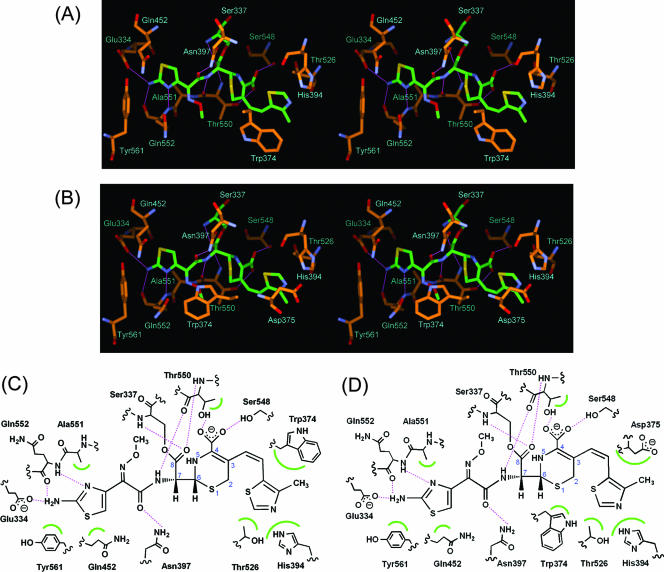
FIG. 4.
Interaction of the trypsin-digested PBP 2X with cefditoren. (A and B) Stereo view of the active sites of the cefditoren-PBP 2X complex structures in molecules 1 and 2, respectively. Atoms are colored as described in the legend to Fig. 3. Hydrogen bonds are represented by thin lines (magenta). (C and D) Schematic diagrams of cefditoren binding mode in molecules 1 and 2, respectively. Hydrogen bonds are represented by broken lines (magenta), and hydrophobic contacts are shown as arcs (green). The atomic numbering scheme of the cephem skeleton is also shown.

