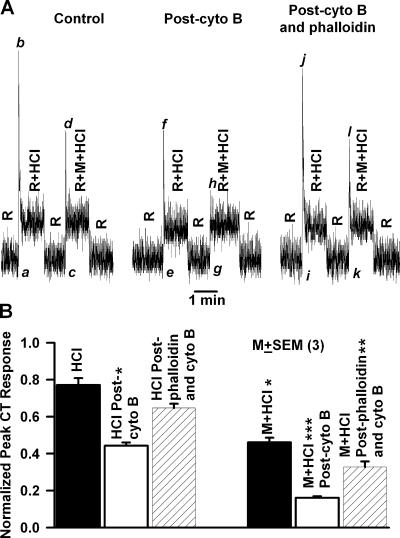
Figure 10.
Effect of cytochalasin B and phalloidin on the CT response to HCl. (A) The CT responses to 20 mM HCl + 10 mM KCl (R+HCl) were recorded relative to the rinse solution, R (10 mM KCl). CT responses were also recorded with both rinse (R+M) and the HCl solution (R+M+HCl) containing, in addition, 500 mM mannitol (M). CT responses were recorded under control conditions (Control), after topical lingual application of 20 μM cytochalasin B for 20 min (Post-cyto B), and after topical lingual application of 1.2 mM phalloidin for 30 min (Post-cyto B and phalloidin). (B) Summary of the effect of cytochalasin B and phalloidin on the CT response to HCl. The relative peak phasic responses (a–b, c–d, e–f, g–h, i–j, and k–l) from three animals were normalized to tonic 300 mM NH4Cl in each individual animal and presented as mean ± SEM for control (black bar), post-cytochalasin (white bar), and post-cytochalasin B and phalloidin treatment (hatched bar). *, P < 0.05; **, P < 0.01; ***, P < 0.001.

