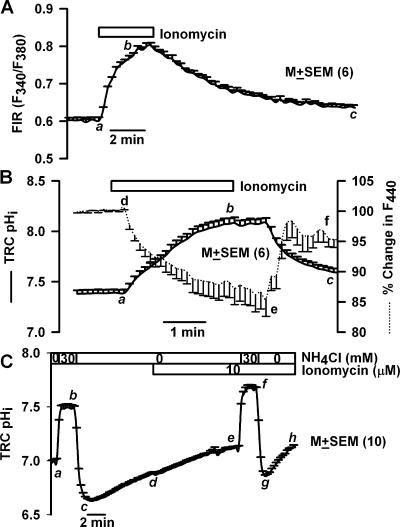
Figure 4.
Effect of changes in [Ca2+]i on TRC pHi and volume. (A) A lingual epithelium loaded with Fura-2 was initially perfused on both sides with control solution containing 150 mM NaCl (pH 7.4). During the time period shown by the top horizontal bar, the basolateral membrane was perfused with the control solution containing, in addition, 10 μM ionomycin. Changes in TRC [Ca2+]i were monitored as temporal changes in FIR (F340/F380). (B and C) Lingual epithelium loaded with BCECF was initially perfused on both sides with control solution containing 150 mM NaCl (pH 7.4). During the time period shown by the top horizontal bar the basolateral membrane was perfused with the control solution containing, in addition, 10 μM ionomycin. Temporal changes in TRC pHi and volume were monitored as changes in FIR (F490/F440, solid line) and fluorescence intensity of the isosbestic wavelength 440 nm (F440, dotted line). The F440 under control conditions for each ROI was taken as 100%. In C the spontaneous pHi recovery rates were monitored by the NH4Cl pulse technique before (c–d) and after ionomycin treatment (g–h). In each case the values are presented as mean ± SEM of n, where n = number of ROIs within the taste bud.

