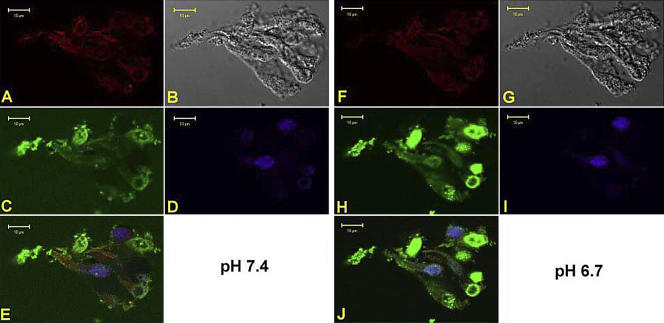
Figure 5.
Labeling of F- and G-actin in an isolated fungiform taste bud fragment at pH 7.4 and 6.7. A confocal image of an optical plane of a fungiform taste bud fragment showing F-actin binding to rhodamine phalloidin (A and F, red), transmitted image (B and G), G-actin binding to pancreatic DNase 1 conjugated with Alexa 488 (C and H, green), staining of TRC nuclei with DAPI (D and I, blue), and an overlay of all images (E and J) are shown while the taste bud was perfused with control solution at pH 7.4 (A–E) or pH 6.7 (F–J).

